How to configure Prometheus Datasource in Grafana using Ansible

Here in this article we will try to configure Prometheus datasource in Grafana using ansible. This Prometheus datasource has an endpoint which collects system level metrics using fluent-bit.
Test Environment
Fedora 39 server
Ansible 2.16.2
If you are interested in watching the video. Here is the YouTube video on the same step by step procedure outlined below.
Procedure
Step1: Ensure Fluent-bit service running
As a first step ensure that fluent-bit service is up and running with the Node Exporter metrics input plugin and Prometheus metrics exporter output plugin. Please follow “How to collect system level metrics using Node Exporter Metrics plugin in fluent-bit” for the same.
Step2: Ensure Prometheus service running
Here in this step we need to ensure that our Prometheus instance is up and running, Also ensure it is configured to scrape the Fluent-bit prometheus metrics exporter endpoint to collect the system level performance metrics. Please follow “How to install and configure Prometheus with Fluent-bit metrics endpoint” for the same.
Step3: Ensure Grafana service running
As a part of this step ensure that you have Granfana service up and running with the default configuration. Please follow “How to install and configure Grafana OSS using ansible“.
Step4: Configure Grafana Prometheus datasource
As a part of this step we are going to update our role “linux_configure_grafana” to configure the “grafana_datasource_template” key value pair as shown below.
admin@fedser:grafana$ cat roles/linux_configure_grafana/defaults/main.yml
---
grafana_config_directory: /etc/grafana
grafana_config_template: grafana.ini
grafana_config_host: fedres.stack.com
grafana_http_port: 3000
grafana_admin_user: admin
grafana_admin_password: admin@2023
grafana_admin_email: admin@stack.com
grafana_datasource_template: prometheus.yml
Here we are defining the grafana prometheus datasource yml definition file which we will be uploading to grafana instance to configure the datasource. This is the very basic prometheus datasource that we can configure with the prometheus scrape endpoint on which post requests are submitted as shown below.
admin@fedser:grafana$ cat roles/linux_configure_grafana/templates/prometheus.yml
apiVersion: 1

datasources:
  - name: Prometheus
    type: prometheus
    access: proxy
    # Access mode - proxy (server in the UI) or direct (browser in the UI).
    url: http://fedres.stack.com:2121
    jsonData:
      httpMethod: POST
      manageAlerts: true
      prometheusType: Prometheus
      prometheusVersion: 2.49.0
      cacheLevel: 'High'
      disableRecordingRules: false
      incrementalQueryOverlapWindow: 10m
Now we can update our tasks main.yml file with the configuration to upload our template prometheus datasource definition file to location “/etc/grafana/provisioning/datasources/” as shown below.
Also we need to update the selinux managed ports for grafana to include the prometheus instance port “2121” to which it connects from grafana to avoid the below error.
admin@fedser:grafana$ cat roles/linux_configure_grafana/tasks/main.yml
- name: "upload grafana config"
  template:
    src: "{{grafana_config_template}}"
    dest: "{{grafana_config_directory}}/grafana.ini"
    owner: "root"
    group: "grafana"
    mode: 0640

- name: "upload grafana prometheus datasource config yml"
  template:
    src: "{{grafana_datasource_template}}"
    dest: "{{grafana_config_directory}}/provisioning/datasources/{{grafana_datasource_template}}"
    owner: "root"
    group: "grafana"
    mode: 0640

- name: Update grafana semanage ports
  seport:
    ports: 3000,2121
    proto: tcp
    setype: grafana_port_t
    state: present
We need to update the selinux managed ports for grafana to include the prometheus instance port “2121” to which it connects from grafana to avoid the below error.
Error
Dec 29 16:07:08 fedres.stack.com audit[6131]: AVC avc:  denied  { name_connect } for  pid=6131 comm="grafana-server" dest=2121 scontext=system_u:system_r:grafana_t:s0 tcontext=system_u:object_r:unreserved_port_t:s0 tclass=tcp_socket permissive=0
Dec 29 16:07:08 fedres.stack.com audit[6131]: AVC avc:  denied  { name_connect } for  pid=6131 comm="grafana-server" dest=2121 scontext=system_u:system_r:grafana_t:s0 tcontext=system_u:object_r:unreserved_port_t:s0 tclass=tcp_socket permissive=0
Step5: Update Grafana with Prometheus datasource configuration
Now its time to update the grafana configuration to upload the prometheus datasource configuration as shown below.
admin@fedser:grafana$ ansible-playbook linux_setup_grafana.yml -i inventory/hosts --extra-vars "grafana_datasource_template=prometheus.yml" --tags "linux_configure_grafana" -v
Using /etc/ansible/ansible.cfg as config file

PLAY [grafana] ***********************************************************************************************************************************************

TASK [Gathering Facts] ***************************************************************************************************************************************
ok: [fedres.stack.com]

TASK [linux_configure_grafana : upload grafana config] *******************************************************************************************************
ok: [fedres.stack.com] => {"changed": false, "checksum": "60de7464f0ea4711e9dd3714f0a669669f8c4cf0", "dest": "/etc/grafana/grafana.ini", "gid": 989, "group": "grafana", "mode": "0640", "owner": "root", "path": "/etc/grafana/grafana.ini", "secontext": "system_u:object_r:grafana_conf_t:s0", "size": 50123, "state": "file", "uid": 0}

TASK [linux_configure_grafana : upload grafana prometheus datasource config yml] *****************************************************************************
ok: [fedres.stack.com] => {"changed": false, "checksum": "91dcf105e6aa2dff260b68ef2769f21df86c98c6", "dest": "/etc/grafana/provisioning/datasources/prometheus.yml", "gid": 989, "group": "grafana", "mode": "0640", "owner": "root", "path": "/etc/grafana/provisioning/datasources/prometheus.yml", "secontext": "system_u:object_r:grafana_conf_t:s0", "size": 918, "state": "file", "uid": 0}

TASK [linux_configure_grafana : Update grafana semanage ports] ***********************************************************************************************
changed: [fedres.stack.com] => {"changed": true, "ports": ["3000", "2121"], "proto": "tcp", "setype": "grafana_port_t", "state": "present"}

PLAY RECAP ***************************************************************************************************************************************************
fedres.stack.com           : ok=4    changed=1    unreachable=0    failed=0    skipped=0    rescued=0    ignored=0
Restart the Grafana service after the configuration update.
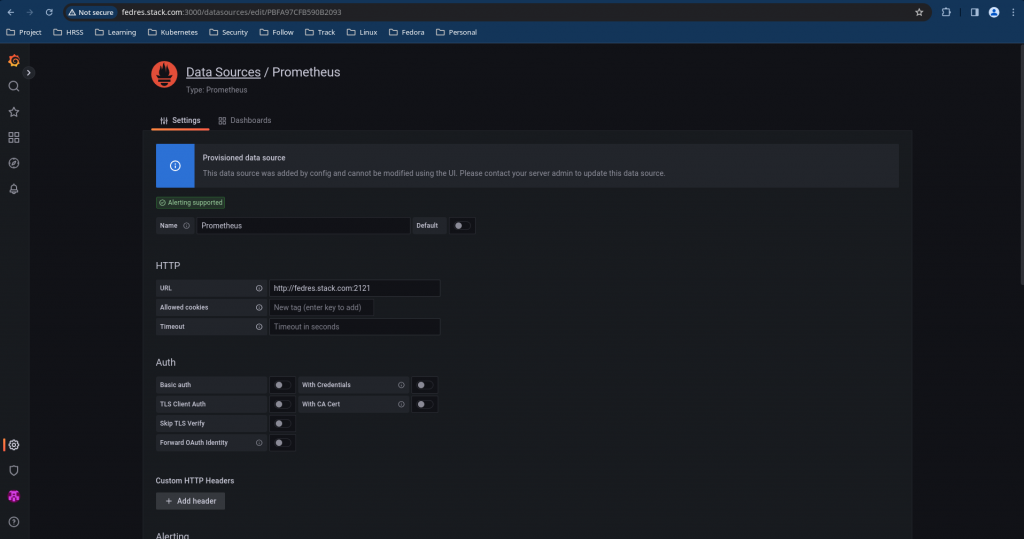
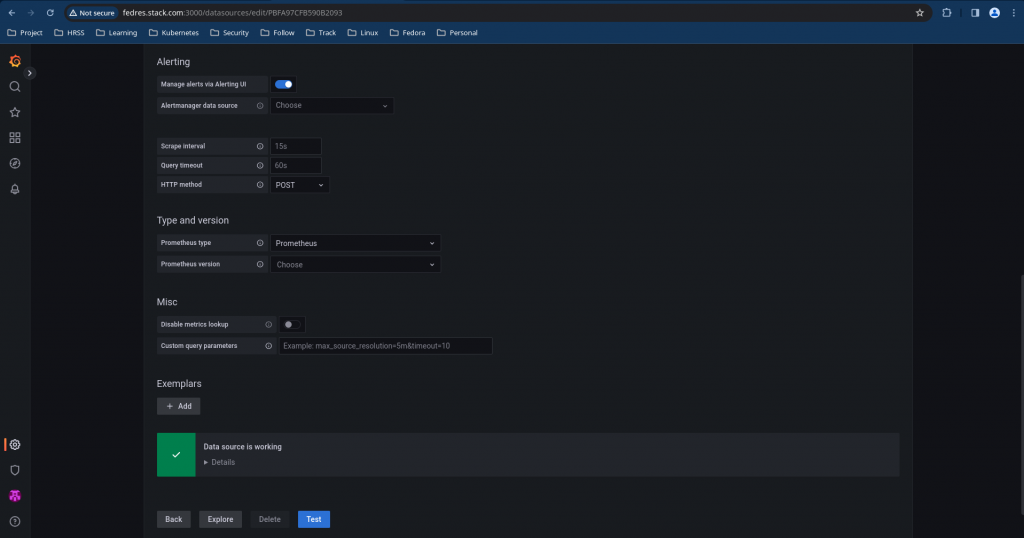
Step6: Validate Prometheus Datasource
Once the datasource configuration is completed. We can check the datasource connection test by going to Grafana Portal – Settings – Datasource and do a test connection for the configured datasource as shown below.
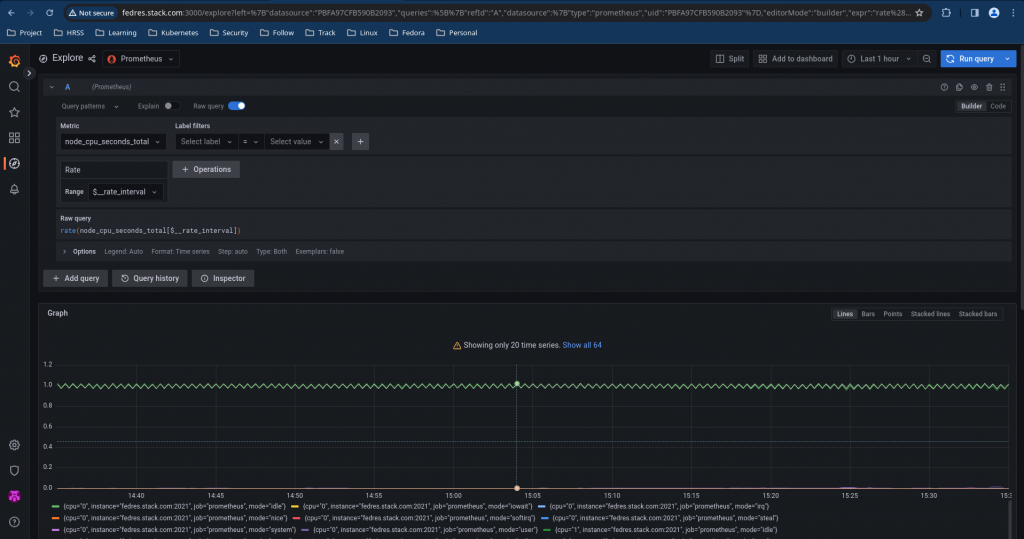
Step7: Analyze Metrics Data
Now we can go into Grafana Portal – Explore to analyze our metrics and generate graphs and reports based on the data.
Hope you enjoyed reading this article. Thank you..
Leave a Reply
You must be logged in to post a comment.