How to install and configure Grafana OSS using ansible

Here in this article we are going to install and configure Grafana using ansible playbook. We are going to customize the grafana configuration to update the default user security settings using ansible.
Test Environment
Fedora 39 workstation
Ansible 2.16.2
What is Grafana
Grafana Open source software also know as Grafana OSS is a multi-platform open source analytics and interactive visualization web application. It provides charts, graphs, and alerts for the web when connected to supported data sources. It enables us to query, visualize, alert and explore the metrics, logs and traces from different sources.
Grafana OSS provides us with different tools and plugin framework for integration with different external datasources. Also it provides us with tools to turn the time-series database (TSDB) data into insightful graphs and visualizations.
Here is the project structure for grafana setup.
admin@fedser:grafana$ tree .
.
├── inventory
│   └── hosts
├── linux_setup_grafana.yml
├── README.md
└── roles
    ├── linux_configure_grafana
    │   ├── defaults
    │   │   └── main.yml
    │   ├── tasks
    │   │   └── main.yml
    │   └── templates
    │       └── grafana.ini
    ├── linux_expose_grafana
    │   ├── defaults
    │   │   └── main.yml
    │   └── tasks
    │       └── main.yml
    ├── linux_install_grafana
    │   ├── defaults
    │   │   └── main.yml
    │   └── tasks
    │       └── main.yml
    ├── linux_ping
    │   └── tasks
    │       └── main.yml
    ├── linux_restart_grafana
    │   └── tasks
    │       └── main.yml
    ├── linux_start_grafana
    │   └── tasks
    │       └── main.yml
    └── linux_stop_grafana
        └── tasks
            └── main.yml
NOTE: Role “linux_ping” can be used to validate the ssh connectivity with the managed hosts as per the inventory file. Here are the details.
admin@fedser:grafana$ cat roles/linux_ping/tasks/main.yml
- name: ansible ping pong validation
  ping:
admin@fedser:grafana$ cat inventory/hosts
[grafana]
fedres.stack.com
If you are interested in watching the video. Here is the YouTube video on the same step by step procedure outlined below.
Procedure
Step1: Install Grafana
As a first step we are going to setup the grafana repository and install grafana from the configured rpm package repository as shown below. Here we are installing the grafana oss distribution package using the role “linux_install_grafana”.
admin@fedser:grafana$ cat roles/linux_install_grafana/defaults/main.yml
---
grafana_install_repo: "https://rpm.grafana.com"
grafana_install_gpg_key: "https://rpm.grafana.com/gpg.key"
admin@fedser:grafana$ cat roles/linux_install_grafana/tasks/main.yml
---
- name: Add grafana repository
  yum_repository:
    name: grafana
    description: grafana repo
    baseurl: "{{grafana_install_repo}}"
    gpgkey: "{{grafana_install_gpg_key}}"
    gpgcheck: true
    repo_gpgcheck: true
    enabled: true
    sslverify: true
    sslcacert: /etc/pki/tls/certs/ca-bundle.crt

- name: Install grafana oss
  dnf:
    name: grafana
    state: present
Step2: Configure Grafana
As a part of this step we are going to customize the configuration of grafana by updating the default grafana.ini configuration as shown below. Please refer to the link for the complete grafana.ini default configuration file.
admin@fedser:grafana$ cat roles/linux_configure_grafana/defaults/main.yml
---
grafana_config_directory: /etc/grafana
grafana_config_template: grafana.ini
grafana_config_host: fedres.stack.com
grafana_http_port: 3000
grafana_admin_user: admin
grafana_admin_password: admin@2023
grafana_admin_email: admin@stack.com
Here i am showing only the section of configuration which we are updating as shown below.
admin@fedser:grafana$ cat roles/linux_configure_grafana/templates/grafana.ini | grep -v ";" | grep -v "#" | grep -v '^$'
...
[paths]
[server]
http_port = {{grafana_http_port}}
[database]
[datasources]
[remote_cache]
[dataproxy]
[analytics]
[security]
admin_user = {{grafana_admin_user}}
admin_password = {{grafana_admin_password}}
admin_email = {{grafana_admin_email}}
[security.encryption]
...

admin@fedser:grafana$ cat roles/linux_configure_grafana/tasks/main.yml
- name: "upload grafana config"
  template:
    src: "{{grafana_config_template}}"
    dest: "{{grafana_config_directory}}/grafana.ini"
    owner: "root"
    group: "grafana"
    mode: 0640
Step3: Start Grafana
Once our grafana configuration is updated. We can start up the grafana service using the role “linux_start_grafana”.
admin@fedser:grafana$ cat roles/linux_start_grafana/tasks/main.yml
- name: "ensure grafana service started"
  service:
    name: grafana-server
    state: started
Step4: Stop Grafana
We can stop the grafana service using the following role “linux_stop_grafana”.
admin@fedser:grafana$ cat roles/linux_stop_grafana/tasks/main.yml
- name: "ensure grafana service stopped"
  service:
    name: grafana-server
    state: stopped
Step5: Restart Grafana
We can restart the grafana service using the following role “linux_restart_grafana”.
admin@fedser:grafana$ cat roles/linux_restart_grafana/tasks/main.yml
- name: "ensure grafana service restarted"
  service:
    name: grafana-server
    state: restarted
Step6: Expose Grafana
Now, we are going to expose the default grafana instance port on which we can access the grafana portal remotely as shown below using the role “linux_expose_grafana”. Once the firewall setting are updated we can restart the firewalld service.
admin@fedser:grafana$ cat roles/linux_expose_grafana/defaults/main.yml
---
grafana_http_port: "3000"
admin@fedser:grafana$ cat roles/linux_expose_grafana/tasks/main.yml
---
- name: expose grafana
  firewalld:
    port: "{{grafana_http_port}}/tcp"
    permanent: true
    immediate: true
    state: enabled

- name: restart firewalld service
  service:
    name: firewalld
    state: restarted
Step7: Grafana Ansible Playbook
Here is the main playbook from which the required roles can be triggered based on the tag information that we pass to the ansible playbook. The instructions to execute are provided in the README.md file below.
admin@fedser:grafana$ cat linux_setup_grafana.yml
---
- hosts: "grafana"
  serial: 1
  become: true
  become_user: root
  roles:
  - { role: "linux_ping", tags: "linux_ping" }
  - { role: "linux_install_grafana", tags: "linux_install_grafana" }
  - { role: "linux_configure_grafana", tags: "linux_configure_grafana" }
  - { role: "linux_restart_grafana", tags: "linux_restart_grafana" }
  - { role: "linux_stop_grafana", tags: "linux_stop_grafana" }
  - { role: "linux_start_grafana", tags: "linux_start_grafana" }
  - { role: "linux_expose_grafana", tags: "linux_expose_grafana" }
Step8: README instructions
Here are the README.md instructions to follow for executing the playbook. Specific role in the playbook can be executed by passing the “–tag” option as shown below.
admin@fedser:grafana$ cat README.md
# Instructions for execution

ansible-playbook linux_setup_grafana.yml -i inventory/hosts --tags "linux_ping" -v
ansible-playbook linux_setup_grafana.yml -i inventory/hosts --tags "linux_install_grafana" -v
ansible-playbook linux_setup_grafana.yml -i inventory/hosts --tags "linux_configure_grafana" -v
ansible-playbook linux_setup_grafana.yml -i inventory/hosts --tags "linux_stop_grafana" -v
ansible-playbook linux_setup_grafana.yml -i inventory/hosts --tags "linux_start_grafana" -v
ansible-playbook linux_setup_grafana.yml -i inventory/hosts --tags "linux_restart_grafana" -v
ansible-playbook linux_setup_grafana.yml -i inventory/hosts --tags "linux_expose_grafana" -v
Step9: Execute Playbook
We can execute specific role by mentioning the “–tags” option as shown in the instructions. But if we want to execute all the roles in a playbook we can run the playbook command without providing the “–tags” option as shown below.
admin@fedser:grafana$ ansible-playbook linux_setup_grafana.yml -i inventory/hosts

PLAY [grafana] ***********************************************************************************************************************************

TASK [Gathering Facts] ***************************************************************************************************************************
ok: [fedres.stack.com]

TASK [linux_ping : ansible ping pong validation] *************************************************************************************************
ok: [fedres.stack.com]

TASK [linux_install_grafana : Add grafana repository] ********************************************************************************************
ok: [fedres.stack.com]

TASK [linux_install_grafana : Install grafana oss] ***********************************************************************************************
ok: [fedres.stack.com]

TASK [linux_configure_grafana : upload grafana config] *******************************************************************************************
ok: [fedres.stack.com]

TASK [linux_restart_grafana : ensure grafana service restarted] **********************************************************************************
changed: [fedres.stack.com]

TASK [linux_stop_grafana : ensure grafana service stopped] ***************************************************************************************
changed: [fedres.stack.com]

TASK [linux_start_grafana : ensure grafana service started] **************************************************************************************
changed: [fedres.stack.com]

TASK [linux_expose_grafana : expose grafana] *****************************************************************************************************
ok: [fedres.stack.com]

TASK [linux_expose_grafana : restart firewalld service] ******************************************************************************************
changed: [fedres.stack.com]

PLAY RECAP ***************************************************************************************************************************************
fedres.stack.com           : ok=10   changed=4    unreachable=0    failed=0    skipped=0    rescued=0    ignored=0
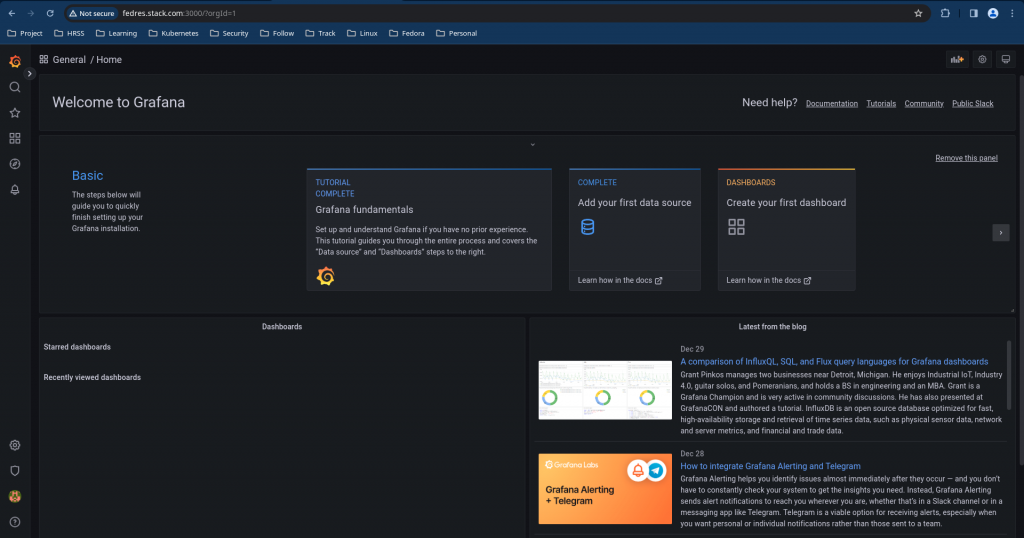
Step10: Validate Results
Once the grafana instance is up and running, you can validate by accessing the grafana portal as shown below.
URL - http://fedres.stack.com:3000/?orgId=1
user - admin
pass - admin@2023
Hope you enjoyed reading this article. Thank you..
Leave a Reply
You must be logged in to post a comment.