How to load balance traffic using queue groups in NATS

Here in this article we will try to understand about Queue Groups and how we can leverge it to load balance traffic between responders in a queue.
Test Environment
- Fedora 41 server
What are Queue Groups
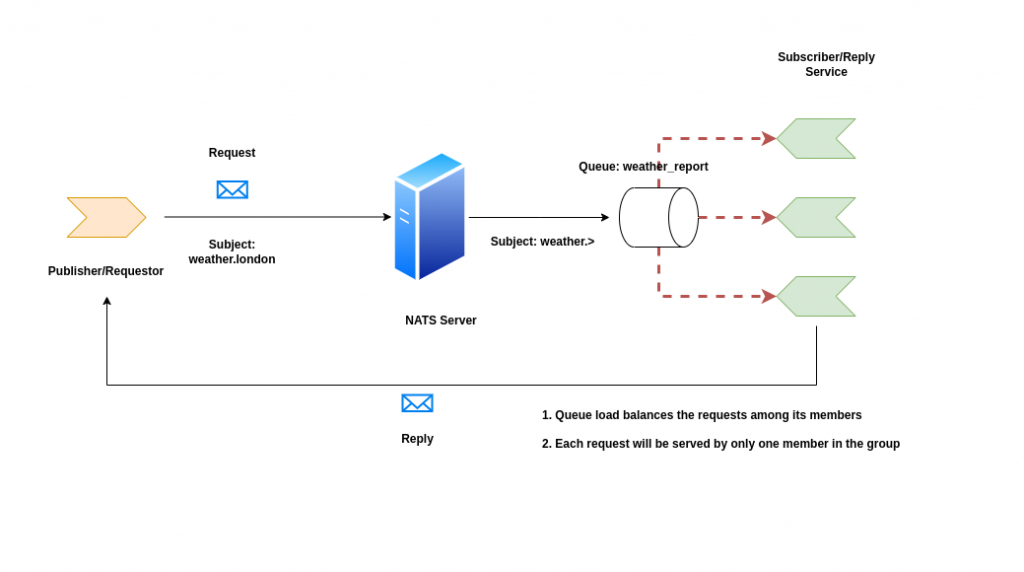
NATS supports the Request-Reply pattern using its core communication mechanism — publish and subscribe. In this model when “n” number of subscribers register themselves to receive messages froma publisher, all the messages that are published on a subject are faned out to all the register subscribers.
If these subscribers register themselves as part of queue group, then only one randomly chosen subscriber of the queue group will consume a message each time a message is received by the queue group. Such distributed queues are a built-in load balancing feature that NATS provides.
Benefits of Queue Groups
- Fault tolerance: In case any subscriber or responder in a queue terminates, the message can still be consumed by another queue member in the group
- Horizontal Scalability: Workload processing can be scaled up or down by increasing or decreasing the number of subscribers in a queue group based on the load
- Queue geo-affinity: Enables intelligent routing of messages to the closest available service instance in queue, minimizing latency. If the closest service instance is unavailable, NATS will seamlessly failover to another instance, all without requiring any application-level configuration
- Ease of Configuration: Queue groups are defined by the application and their queue subscribers, rather than the server configuration
High Level Architecture
If you are interested in watching the video. Here is the YouTube video on the same step by step procedure outlined below.
Procedure
Step1: Ensure NAT Server and CLI tools installed
As a first step ensure that you have NAT server and cli tools installed on your local system for this demo. Follow “How to implement messaging application using NATS” for more details.
Let’s start our nats-server in standalone mode with monitoring enabled on port 8222.
admin@linuxser:~$ nats-server -m 8222
[2257] 2025/07/22 22:56:15.337735 [INF] Starting nats-server
[2257] 2025/07/22 22:56:15.337896 [INF]   Version:  2.10.20
[2257] 2025/07/22 22:56:15.337920 [INF]   Git:      [7140387]
[2257] 2025/07/22 22:56:15.337929 [INF]   Name:     NCKWYNAC4LA2ABCM5VU26EL6D6ZFOAANRHE2V5ZDGPMHZDSANNL6AOMA
[2257] 2025/07/22 22:56:15.337935 [INF]   ID:       NCKWYNAC4LA2ABCM5VU26EL6D6ZFOAANRHE2V5ZDGPMHZDSANNL6AOMA
[2257] 2025/07/22 22:56:15.339010 [INF] Starting http monitor on 0.0.0.0:8222
[2257] 2025/07/22 22:56:15.339337 [INF] Listening for client connections on 0.0.0.0:4222
[2257] 2025/07/22 22:56:15.340229 [INF] Server is ready
admin@linuxser:~$ nats --version
Step2: Create a service
Here we will use a third party API service which provides weather information of any particular region.
The “command” supports extracting some information from the subject the request came in on. When the subject being listened on is “weather.>” a request on “weather.london” can extract the “london” part and use it in the command string.
admin@linuxser:~$ nats reply 'weather.>' --command "curl -s wttr.in/{{1}}?format=3"

22:30:10 Listening on "weather.>" in group "NATS-RPLY-22"
By default as we can see this service is part of a default group named “NATS-RPLY-22”. If we want the service to be part of a custom group, we can pass the group name as shown below.
We can launch “n” number of services as a part of this group to ensure high availability and fault tolerance.
Let’s launch three reply service instance registered under the group “weather_report”.
admin@linuxser:~$ nats reply 'weather.>' --command "curl -s wttr.in/{{1}}?format=3" --queue weather_report
22:41:55 Listening on "weather.>" in group "weather_report"

admin@linuxser:~$ nats reply 'weather.>' --command "curl -s wttr.in/{{1}}?format=3" --queue weather_report
22:44:15 Listening on "weather.>" in group "weather_report"

admin@linuxser:~$ nats reply 'weather.>' --command "curl -s wttr.in/{{1}}?format=3" --queue weather_report
22:44:59 Listening on "weather.>" in group "weather_report"
Step3: Request a service
Now let’s try to access our service by sending a request as shown below and parallely monitor the console for responders and you will see that only one responder would send a reply to the service request.
admin@linuxser:~$ nats request "weather.tokyo" ''
22:48:44 Sending request on "weather.tokyo"
22:48:44 Received with rtt 398.161316ms
tokyo: ☀️   +27°C
If we try to send “n” number of requests, you will see that the service request will be load balanced by default among the three responders in the group “weather_report”.
admin@linuxser:~$ nats request "weather.tokyo" '' --count 5
22:58:07 Sending request on "weather.tokyo"
22:58:08 Received with rtt 397.121305ms
tokyo: ☀️   +27°C

22:58:08 Sending request on "weather.tokyo"
22:58:08 Received with rtt 308.282812ms
tokyo: ☀️   +27°C

22:58:08 Sending request on "weather.tokyo"
22:58:08 Received with rtt 407.234342ms
tokyo: ☀️   +27°C

22:58:08 Sending request on "weather.tokyo"
22:58:09 Received with rtt 453.448706ms
tokyo: ☀️   +27°C

22:58:09 Sending request on "weather.tokyo"
22:58:09 Received with rtt 472.340283ms
tokyo: ☀️   +27°C
Step4: Validate the Connection Stats
As we have enabled monitoring on port 8222, we can see the statistics of the number of connections or responders in our case and total number of requests that were received by each connection in “in_msgs” and responses that were delivered by each connection “out_msgs”.
Launch the below url and navigate to Connections to see the details.
URL: http://linuxser.stack.com:8222

Hope you enjoyed reading this article. Thank you..
Leave a Reply
You must be logged in to post a comment.