How to install and configure Prometheus with Fluent-bit metrics endpoint

Here in this article we will try to install and configure prometheus to scrap the metrics that we are exposing using the FLuent-bit node exporter and prometheus metrics plugin.
Test Environment
Fedora 39 workstation
Ansible 2.16.2
What is Prometheus
Prometheus is a core technology for monitoring and observability of systems. Prometheus is a technology that collects and stores time series data. Time series are fundamental to Prometheus. Prometheus and similar software provide tools to compact and optimize time series data.
Here is the project structure for prometheus setup.
admin@fedser:prometheus$ tree .
.
├── inventory
│   └── hosts
├── linux_setup_prometheus.yml
├── README.md
└── roles
    ├── linux_configure_prometheus
    │   ├── defaults
    │   │   └── main.yml
    │   ├── tasks
    │   │   └── main.yml
    │   └── templates
    │       └── prometheus.yml
    ├── linux_expose_prometheus
    │   ├── defaults
    │   │   └── main.yml
    │   └── tasks
    │       └── main.yml
    ├── linux_install_prometheus
    │   ├── defaults
    │   │   └── main.yml
    │   └── tasks
    │       └── main.yml
    ├── linux_ping
    │   └── tasks
    │       └── main.yml
    ├── linux_restart_prometheus
    │   └── tasks
    │       └── main.yml
    ├── linux_start_prometheus
    │   ├── defaults
    │   │   └── main.yml
    │   └── tasks
    │       └── main.yml
    └── linux_stop_prometheus
        └── tasks
            └── main.yml
NOTE: Role “linux_ping” can be used to validate the ssh connectivity with the managed hosts as per the inventory file. Here are the details.
admin@fedser:fluentbit$ cat roles/linux_ping/tasks/main.yml
- name: ansible ping pong validation
  ping:
admin@fedser:fluentbit$ cat inventory/hosts
[fluent-bit]
fedres.stack.com
If you are interested in watching the video. Here is the YouTube video on the same step by step procedure outlined below.
Procedure
Step1: Ensure Fluent-bit service running
As a first step ensure that fluent-bit service is up and running with the Node Exporter metrics input plugin and Prometheus metrics exporter output plugin. Please follow “How to collect system level metrics using Node Exporter Metrics plugin in fluent-bit“.
Step2: Install Prometheus
The following role “linux_install_prometheus” will install prometheus from the compressed binary package as shown below.
admin@fedser:prometheus$ cat roles/linux_install_prometheus/defaults/main.yml
---
prometheus_install_package: "https://github.com/prometheus/prometheus/releases/download/v2.49.0-rc.1/prometheus-2.49.0-rc.1.linux-amd64.tar.gz"
prometheus_download_directory: "/opt/software"
prometheus_install_directory: "/opt/prometheus"
prometheus_user: "admin"
prometheus_group: "admin"
admin@fedser:prometheus$ cat roles/linux_install_prometheus/tasks/main.yml
---
- name: ensure software directory exists
  file:
    path: "{{prometheus_download_directory}}"
    state: directory
    owner: "{{prometheus_user}}"
    group: "{{prometheus_user}}"
    mode: 0755

- name: ensure installation directory exists
  file:
    path: "{{prometheus_install_directory}}"
    state: directory
    owner: "{{prometheus_user}}"
    group: "{{prometheus_user}}"
    mode: 0755

- name: Download prometheus package
  get_url:
    url: "{{prometheus_install_package}}"
    dest: "{{prometheus_download_directory}}/prometheus.tar.gz"
    owner: "{{prometheus_user}}"
    group: "{{prometheus_user}}"
    mode: 0755

- name: Extract prometheus package
  unarchive:
    src: "{{prometheus_download_directory}}/prometheus.tar.gz"
    dest: "{{prometheus_install_directory}}"
    owner: "{{prometheus_user}}"
    group: "{{prometheus_user}}"
    remote_src: true
Step3: Configure Prometheus
Here in this role “linux_configure_prometheus” we are going to configure prometheus with a custom configuration file updated with the fluent-bit prometheus metrics exporter endopoint (ie. fedres.stack.com:2021) as shown below. Once the prometheus instance is configured with this endpoint we will be able to access the node metrics using the prometheus ui.
admin@fedser:prometheus$ cat roles/linux_configure_prometheus/defaults/main.yml
---
#prometheus_config_directory: /etc/prometheus
prometheus_config_template: prometheus.yml
prometheus_download_directory: "/opt/software"
prometheus_install_directory: "/opt/prometheus"
prometheus_user: "admin"
prometheus_group: "admin"
prometheus_scrape_host: fedres.stack.com
prometheus_scrape_port: 2021
admin@fedser:prometheus$ cat roles/linux_configure_prometheus/templates/prometheus.yml
# my global config
global:
  scrape_interval: 15s # Set the scrape interval to every 15 seconds. Default is every 1 minute.
  evaluation_interval: 15s # Evaluate rules every 15 seconds. The default is every 1 minute.
  # scrape_timeout is set to the global default (10s).

# Alertmanager configuration
alerting:
  alertmanagers:
    - static_configs:
        - targets:
          # - alertmanager:9093

# Load rules once and periodically evaluate them according to the global 'evaluation_interval'.
rule_files:
  # - "first_rules.yml"
  # - "second_rules.yml"

# A scrape configuration containing exactly one endpoint to scrape:
# Here it's Prometheus itself.
scrape_configs:
  # The job name is added as a label `job=<job_name>` to any timeseries scraped from this config.
  - job_name: "prometheus"

    # metrics_path defaults to '/metrics'
    # scheme defaults to 'http'.

    static_configs:
      - targets: ["{{prometheus_scrape_host}}:{{prometheus_scrape_port}}"]
admin@fedser:prometheus$ cat roles/linux_configure_prometheus/tasks/main.yml
- name: find prometheus config
  command: "find {{prometheus_install_directory}}/ -type f -name {{prometheus_config_template}}"
  register: prometheus_config_file

- debug: msg="{{prometheus_config_file.stdout}}"

- set_fact:
    prometheus_config_file: "{{ prometheus_config_file.stdout }}"

- name: "upload prometheus config"
  template:
    src: "{{prometheus_config_template}}"
    dest: "{{prometheus_config_file}}"
    owner: "{{prometheus_user}}"
    group: "{{prometheus_group}}"
    mode: 0644
Step4: Start Prometheus
As a part of this role “linux_start_prometheus” we will starting up prometheus with the customized configuration file and also update the default prometheus instance port from 9090 to 2121.
NOTE: The port “9090” is the default port the cockpit in Fedora server.
admin@fedser:prometheus$ cat roles/linux_start_prometheus/tasks/main.yml
- name: find prometheus binary
  command: "find /opt/prometheus/ -type f -name prometheus"
  register: prometheus_install_binary

- name: find prometheus config
  command: "find /opt/prometheus/ -type f -name prometheus.yml"
  register: prometheus_config_file

- debug: msg="{{prometheus_install_binary.stdout}}"

- debug: msg="{{prometheus_config_file.stdout}}"

- set_fact:
    prometheus_install_binary: "{{ prometheus_install_binary.stdout }}"

- set_fact:
    prometheus_config_file: "{{ prometheus_config_file.stdout }}"

- name: "ensure prometheus service started"
  shell: "{{prometheus_install_binary}} --config.file={{prometheus_config_file}} --web.listen-address='{{prometheus_listen_address}}:{{prometheus_listen_port}}' 2>&1 &"
admin@fedser:prometheus$ cat roles/linux_start_prometheus/defaults/main.yml
---
prometheus_listen_address: "0.0.0.0"
prometheus_listen_port: "2121"
Step5: Stop Prometheus
The following role “linux_stop_prometheus” will try to identify the process id for the running instance of prometheus and will try to stop it using the “kill -9”. You can also carry out a graceful stop of the process using the appropriate process shutdown signal.
admin@fedser:prometheus$ cat roles/linux_stop_prometheus/tasks/main.yml
- name: identify the prometheus process id
  command: "pgrep -f prometheus"
  register: prometheus_process_id

- debug: msg="{{prometheus_process_id.stdout}}"

- set_fact:
    prometheus_process_id: "{{ prometheus_process_id.stdout }}"

- name: ensure prometheus stopped
  command: "kill -9 {{prometheus_process_id}}"
Step6: Restart Prometheus
This role “linux_restart_prometheus” is provided incase you have prometheus instance running but you want to restart it to ensure that any updated configuration are taken into effect.
admin@fedser:prometheus$ cat roles/linux_restart_prometheus/tasks/main.yml
- name: ensure prometheus service stopped
  include_role:
    name: linux_stop_prometheus

- name: ensure prometheus service started
  include_role:
    name: linux_start_prometheus
Step7: Expose Prometheus Instance Port
Here we are using the role “linux_expose_prometheus” to update the firewall rules to allow access on port “2121” and restart the firewalld service as shown below.
admin@fedser:prometheus$ cat roles/linux_expose_prometheus/defaults/main.yml
---
prometheus_listen_port: "2121"

admin@fedser:prometheus$ cat roles/linux_expose_prometheus/tasks/main.yml
---
- name: expose prometheus
  firewalld:
    port: "{{prometheus_listen_port}}/tcp"
    permanent: true
    immediate: true
    state: enabled

- name: restart firewalld service
  service:
    name: firewalld
    state: restarted
Step8: Prometheus Ansible Playbook
Here is the completed ansible playbook for Prometheus setup. Please note, we have commented out “linux_restart_prometheus” and “linux_stop_prometheus” which can be executed as per our requirements.
admin@fedser:prometheus$ cat linux_setup_prometheus.yml
---
- hosts: "prometheus"
  serial: 1
  become: true
  become_user: root
  roles:
  - { role: "linux_ping", tags: "linux_ping" }
  - { role: "linux_install_prometheus", tags: "linux_install_prometheus" }
  - { role: "linux_configure_prometheus", tags: "linux_configure_prometheus" }
  - { role: "linux_start_prometheus", become_user: "admin", tags: "linux_start_prometheus" }
#  - { role: "linux_restart_prometheus", become_user: "admin", tags: "linux_restart_prometheus" }
#  - { role: "linux_stop_prometheus", become_user: "admin", tags: "linux_stop_prometheus" }
  - { role: "linux_expose_prometheus", tags: "linux_expose_prometheus" }
Step9: README Instructions
Here is the README instructions on how we can execute the playbook. If we execute the playbook without any “–tags ” option all the enabled roles will be executed in the sequence written in the playbook.
admin@fedser:prometheus$ cat README.md
# Instructions for execution

ansible-playbook linux_setup_prometheus.yml -i inventory/hosts --tags "linux_ping" -v
ansible-playbook linux_setup_prometheus.yml -i inventory/hosts --tags "linux_install_prometheus" -v
ansible-playbook linux_setup_prometheus.yml -i inventory/hosts --tags "linux_configure_prometheus" -v
ansible-playbook linux_setup_prometheus.yml -i inventory/hosts --tags "linux_stop_prometheus" -v
ansible-playbook linux_setup_prometheus.yml -i inventory/hosts --tags "linux_start_prometheus" -v
ansible-playbook linux_setup_prometheus.yml -i inventory/hosts --tags "linux_restart_prometheus" -v
ansible-playbook linux_setup_prometheus.yml -i inventory/hosts --tags "linux_expose_prometheus" -v
Step9: Execute Playbook
Let’s now execute our playbook to install and configure prometheus. As shown below we are not passing any “–tags” so that all the roles are executed in the sequential order.
admin@fedser:prometheus$ ansible-playbook linux_setup_prometheus.yml -i inventory/hosts

PLAY [prometheus] ***********************************************************************************************************************************************************

TASK [Gathering Facts] ******************************************************************************************************************************************************
ok: [fedres.stack.com]

TASK [linux_ping : ansible ping pong validation] ****************************************************************************************************************************
ok: [fedres.stack.com]

TASK [linux_install_prometheus : ensure software directory exists] **********************************************************************************************************
ok: [fedres.stack.com]

TASK [linux_install_prometheus : ensure installation directory exists] ******************************************************************************************************
ok: [fedres.stack.com]

TASK [linux_install_prometheus : Download prometheus package] ***************************************************************************************************************
ok: [fedres.stack.com]

TASK [linux_install_prometheus : Extract prometheus package] ****************************************************************************************************************
changed: [fedres.stack.com]

TASK [linux_configure_prometheus : find prometheus config] ******************************************************************************************************************
changed: [fedres.stack.com]

TASK [linux_configure_prometheus : debug] ***********************************************************************************************************************************
ok: [fedres.stack.com] => {
    "msg": "/opt/prometheus/prometheus-2.49.0-rc.1.linux-amd64/prometheus.yml"
}

TASK [linux_configure_prometheus : set_fact] ********************************************************************************************************************************
ok: [fedres.stack.com]

TASK [linux_configure_prometheus : upload prometheus config] ****************************************************************************************************************
changed: [fedres.stack.com]

TASK [linux_start_prometheus : find prometheus binary] **********************************************************************************************************************
changed: [fedres.stack.com]

TASK [linux_start_prometheus : find prometheus config] **********************************************************************************************************************
changed: [fedres.stack.com]

TASK [linux_start_prometheus : debug] ***************************************************************************************************************************************
ok: [fedres.stack.com] => {
    "msg": "/opt/prometheus/prometheus-2.49.0-rc.1.linux-amd64/prometheus"
}

TASK [linux_start_prometheus : debug] ***************************************************************************************************************************************
ok: [fedres.stack.com] => {
    "msg": "/opt/prometheus/prometheus-2.49.0-rc.1.linux-amd64/prometheus.yml"
}

TASK [linux_start_prometheus : set_fact] ************************************************************************************************************************************
ok: [fedres.stack.com]

TASK [linux_start_prometheus : set_fact] ************************************************************************************************************************************
ok: [fedres.stack.com]

TASK [linux_start_prometheus : ensure prometheus service started] ***********************************************************************************************************
changed: [fedres.stack.com]

TASK [linux_expose_prometheus : expose prometheus] **************************************************************************************************************************
ok: [fedres.stack.com]

TASK [linux_expose_prometheus : restart firewalld service] ******************************************************************************************************************
changed: [fedres.stack.com]

PLAY RECAP ******************************************************************************************************************************************************************
fedres.stack.com           : ok=19   changed=7    unreachable=0    failed=0    skipped=0    rescued=0    ignored=0
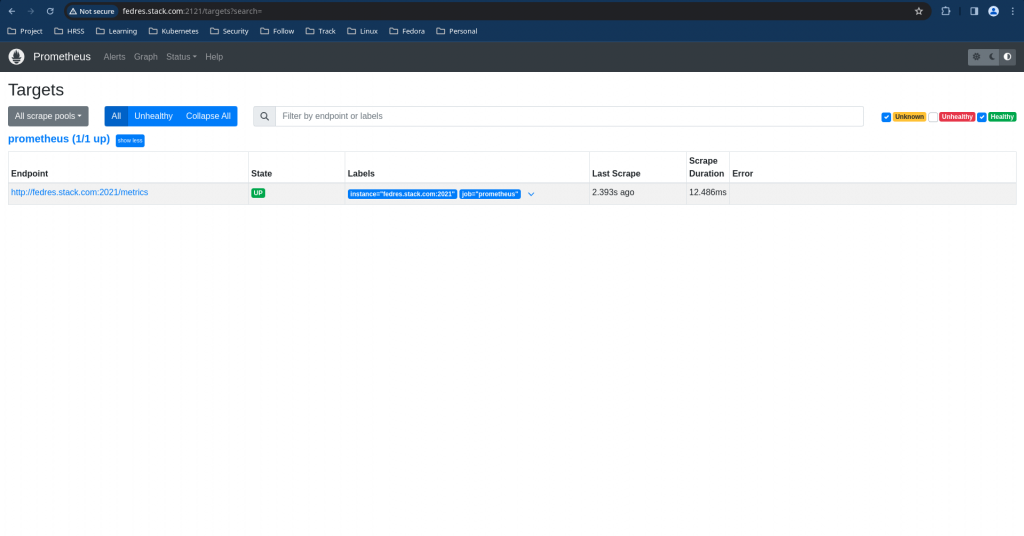
Step11: Validate Prometheus
Now we can validate the Prometheus instance by accessing the portal at the following.
URL - http://fedres.stack.com:2121/
Once accessed, you can navigate to Status – Targets to check the status of the Node endpoints from which the metrics are being scraped.
Hope you enjoyed reading this article. Thank you..
Leave a Reply
You must be logged in to post a comment.