How to collect system level metrics using Node Exporter Metrics plugin in fluent-bit

Here in this article we will try to configure our fluent-bit with Node Exporter Metrics input plugin to collect system level metrics. We will further expose the metrics using Prometheus Exporter output plugin and expose it on the default port.
Test Environment
Fedora 39 workstation
Ansible 2.16.2
If you are interested in watching the video. Here is the YouTube video on the same step by step procedure outlined below.
Procedure
Step1: Ensure fluent-bit service running
We need to setup and start our fluent-bit service. Please follow “How to install and configure Fluent Bit using Ansible” to carry of the default setup of fluent-bit.
Step2: Update fluent-bit configuration
As a part of this step we will be enabling “node_exporter_metrics” input plugin which will help us in collecting the system level metrics such as CPU / Disk / Network / Process statistics. Also we are exposing the fluent-bit service metrics using the “fluentbit_metrics” plugin.
The metrics that are collected and consumed using two plugin. “stdout” prints the metrics that are collected to the journal logs of the fluent-bit service and “prometheus_exporter” exposes those metrics on port 2021 which can be accessed using the http protocol.
admin@fedser:fluentbit$ cat roles/linux_configure_fluentbit/templates/node-exporter_prometheus.conf
[SERVICE]
    flush        1
    daemon       Off
    log_level    info
    parsers_file parsers.conf
    plugins_file plugins.conf
    http_server  Off
    http_listen  0.0.0.0
    http_port    2020
    storage.metrics on

[INPUT]
    name            node_exporter_metrics
    tag             node_metrics
    scrape_interval 2

[INPUT]
    name            fluentbit_metrics
    tag             internal_metrics
    scrape_interval 2

[OUTPUT]
    name  stdout
    match *

[OUTPUT]
    name            prometheus_exporter
    match           *_metrics
    host            0.0.0.0
    port            2021
Step3: Expose Prometheus exporter port
Here we are extending our fluent-bit project to include a new role “linux_expose_fluentbit” to enable the port “2021” at the firewall level and restart the firewalld service as shown below.
admin@fedser:fluentbit$ cat roles/linux_expose_fluentbit/tasks/main.yml
---
- name: expose prometheus endpoint
  firewalld:
    port: 2021/tcp
    permanent: true
    immediate: true
    state: enabled

- name: restart firewalld service
  service:
    name: firewalld
    state: restarted
Step4: Update Ansible Playbook
Now, we will update the ansible playbook to include our new role “linux_expose_fluentbit” to expose the prometheus exporter port as shown below.
admin@fedser:fluentbit$ cat linux_setup_fluentbit.yml
---
- hosts: "fluent-bit"
  serial: 1
  become: true
  become_user: root
  roles:
  - { role: "linux_ping", tags: "linux_ping" }
  - { role: "linux_install_fluentbit", tags: "linux_install_fluentbit" }
  - { role: "linux_configure_fluentbit", tags: "linux_configure_fluentbit" }
  - { role: "linux_restart_fluentbit", tags: "linux_restart_fluentbit" }
  - { role: "linux_stop_fluentbit", tags: "linux_stop_fluentbit" }
  - { role: "linux_start_fluentbit", tags: "linux_start_fluentbit" }
  - { role: "linux_expose_fluentbit", tags: "linux_expose_fluentbit" }
Step5: Update README instructions
Here we have update the instructions for role “linux_expose_fluentbit” to export port “2021” and “linux_configure_fluentbit” to execute the playbook with ‘–extra-vars “fluentbit_config_template=node-exporter_prometheus.conf’ to configure the fluent-bit service with prometheus input and output plugins.
admin@fedser:fluentbit$ cat README.md
# Instructions for execution
--tags "linux_ping"
ansible-playbook linux_setup_fluentbit.yml -i inventory/hosts  -v
ansible-playbook linux_setup_fluentbit.yml -i inventory/hosts --tags "linux_install_fluentbit" -v
ansible-playbook linux_setup_fluentbit.yml -i inventory/hosts --tags "linux_configure_fluentbit" -v
ansible-playbook linux_setup_fluentbit.yml -i inventory/hosts --tags "linux_stop_fluentbit" -v
ansible-playbook linux_setup_fluentbit.yml -i inventory/hosts --tags "linux_start_fluentbit" -v
ansible-playbook linux_setup_fluentbit.yml -i inventory/hosts --tags "linux_restart_fluentbit" -v
ansible-playbook linux_setup_fluentbit.yml -i inventory/hosts --tags "linux_expose_fluentbit" -v


# load specific config
ansible-playbook linux_setup_fluentbit.yml -i inventory/hosts --extra-vars "fluentbit_config_template=collectd_stdout.conf" --tags "linux_configure_fluentbit" -v
ansible-playbook linux_setup_fluentbit.yml -i inventory/hosts --extra-vars "fluentbit_config_template=cpu-mem-disk-netio_stdout.conf" --tags "linux_configure_fluentbit" -v
ansible-playbook linux_setup_fluentbit.yml -i inventory/hosts --extra-vars "fluentbit_config_template=node-exporter_prometheus.conf" --tags "linux_configure_fluentbit" -v
Step6: Update Fluent-bit Configuration
Now let’s excecute the playbook as shown below to update the fluent-bit configuration.
admin@fedser:fluentbit$ ansible-playbook linux_setup_fluentbit.yml -i inventory/hosts --extra-vars "fluentbit_config_template=node-exporter_prometheus.conf" --tags "linux_configure_fluentbit" -v
Using /etc/ansible/ansible.cfg as config file
[WARNING]: Invalid characters were found in group names but not replaced, use -vvvv to see details

PLAY [fluent-bit] ***********************************************************************************************************************************************************

TASK [Gathering Facts] ******************************************************************************************************************************************************
ok: [fedres.stack.com]

TASK [linux_configure_fluentbit : upload fluent-bit config] *****************************************************************************************************************
changed: [fedres.stack.com] => {"changed": true, "checksum": "40da8a32dd8667b107eb9d515940bdf430ce9ef7", "dest": "/etc/fluent-bit/fluent-bit.conf", "gid": 0, "group": "root", "md5sum": "31442a886cb162f792ffe860f4106e07", "mode": "0644", "owner": "root", "secontext": "system_u:object_r:etc_t:s0", "size": 607, "src": "/home/admin/.ansible/tmp/ansible-tmp-1703612400.9052894-12026-217581240195037/source", "state": "file", "uid": 0}

PLAY RECAP ******************************************************************************************************************************************************************
fedres.stack.com           : ok=2    changed=1    unreachable=0    failed=0    skipped=0    rescued=0    ignored=0
Step7: Expose Prometheus Exporter Port
Here we are executing the playbook with tag “linux_expose_fluentbit” to expose the port on firewall and restart the service.
admin@fedser:fluentbit$ ansible-playbook linux_setup_fluentbit.yml -i inventory/hosts --tags "linux_expose_fluentbit"
[WARNING]: Invalid characters were found in group names but not replaced, use -vvvv to see details

PLAY [fluent-bit] ***********************************************************************************************************************************************************

TASK [Gathering Facts] ******************************************************************************************************************************************************
ok: [fedres.stack.com]

TASK [linux_expose_fluentbit : expose prometheus endpoint] ******************************************************************************************************************
ok: [fedres.stack.com]

TASK [linux_expose_fluentbit : restart firewalld service] *******************************************************************************************************************
changed: [fedres.stack.com]

PLAY RECAP ******************************************************************************************************************************************************************
fedres.stack.com           : ok=3    changed=1    unreachable=0    failed=0    skipped=0    rescued=0    ignored=0
Step8: Restart Fluent-bit service
admin@fedser:fluentbit$ ansible-playbook linux_setup_fluentbit.yml -i inventory/hosts --tags "linux_restart_fluentbit"
[WARNING]: Invalid characters were found in group names but not replaced, use -vvvv to see details

PLAY [fluent-bit] ***********************************************************************************************************************************************************

TASK [Gathering Facts] ******************************************************************************************************************************************************
ok: [fedres.stack.com]

TASK [linux_restart_fluentbit : ensure fluent-bit service running] **********************************************************************************************************
changed: [fedres.stack.com]

PLAY RECAP ******************************************************************************************************************************************************************
fedres.stack.com           : ok=2    changed=1    unreachable=0    failed=0    skipped=0    rescued=0    ignored=0
Step9: Validate Results
As we are consuming the metrics using the “stdout” plugin. We can capture the results using the journalctl as shown below.
journalctl -fu fluent-bit
Journal file /var/log/journal/7a739d8ccf224d768c349563fc2f723f/system@00060d3673e28e40-307d596b210db788.journal~ is truncated, ignoring file.
Dec 26 23:12:52 fedres.stack.com fluent-bit[2973]: 2023-12-26T17:42:15.501414997Z fluentbit_output_retried_records_total{name="stdout.0"} = 0
Dec 26 23:12:52 fedres.stack.com fluent-bit[2973]: 2023-12-26T17:42:50.446280498Z fluentbit_output_proc_records_total{name="prometheus_exporter.1"} = 34
Dec 26 23:12:52 fedres.stack.com fluent-bit[2973]: 2023-12-26T17:42:50.446280498Z fluentbit_output_proc_bytes_total{name="prometheus_exporter.1"} = 684573
Dec 26 23:12:52 fedres.stack.com fluent-bit[2973]: 2023-12-26T17:42:15.501836171Z fluentbit_output_errors_total{name="prometheus_exporter.1"} = 0
Dec 26 23:12:52 fedres.stack.com fluent-bit[2973]: 2023-12-26T17:42:15.501836171Z fluentbit_output_retries_total{name="prometheus_exporter.1"} = 0
Dec 26 23:12:52 fedres.stack.com fluent-bit[2973]: 2023-12-26T17:42:15.501836171Z fluentbit_output_retries_failed_total{name="prometheus_exporter.1"} = 0
Dec 26 23:12:52 fedres.stack.com fluent-bit[2973]: 2023-12-26T17:42:15.501836171Z fluentbit_output_dropped_records_total{name="prometheus_exporter.1"} = 0
Dec 26 23:12:52 fedres.stack.com fluent-bit[2973]: 2023-12-26T17:42:15.501836171Z fluentbit_output_retried_records_total{name="prometheus_exporter.1"} = 0
Dec 26 23:12:52 fedres.stack.com fluent-bit[2973]: 2023-12-26T17:42:51.446084618Z fluentbit_process_start_time_seconds{hostname="fedres.stack.com"} = 1703612535
Dec 26 23:12:52 fedres.stack.com fluent-bit[2973]: 2023-12-26T17:42:51.446084618Z fluentbit_build_info{hostname="fedres.stack.com",version="1.9.9",os="linux"} = 1703612535
Dec 26 23:12:54 fedres.stack.com fluent-bit[2973]: 2023-12-26T17:42:53.442546812Z node_cpu_seconds_total{cpu="0",mode="idle"} = 202.44
Dec 26 23:12:54 fedres.stack.com fluent-bit[2973]: 2023-12-26T17:42:53.442546812Z node_cpu_seconds_total{cpu="0",mode="iowait"} = 0.38
Dec 26 23:12:54 fedres.stack.com fluent-bit[2973]: 2023-12-26T17:42:53.442546812Z node_cpu_seconds_total{cpu="0",mode="irq"} = 0.26000000000000001
Dec 26 23:12:54 fedres.stack.com fluent-bit[2973]: 2023-12-26T17:42:53.442546812Z node_cpu_seconds_total{cpu="0",mode="nice"} = 0.02
Dec 26 23:12:54 fedres.stack.com fluent-bit[2973]: 2023-12-26T17:42:53.442546812Z node_cpu_seconds_total{cpu="0",mode="softirq"} = 0.12
Dec 26 23:12:54 fedres.stack.com fluent-bit[2973]: 2023-12-26T17:42:53.442546812Z node_cpu_seconds_total{cpu="0",mode="steal"} = 2.3199999999999998
Dec 26 23:12:54 fedres.stack.com fluent-bit[2973]: 2023-12-26T17:42:53.442546812Z node_cpu_seconds_total{cpu="0",mode="system"} = 1.1599999999999999
Dec 26 23:12:54 fedres.stack.com fluent-bit[2973]: 2023-12-26T17:42:53.442546812Z node_cpu_seconds_total{cpu="0",mode="user"} = 1.3200000000000001
Dec 26 23:12:54 fedres.stack.com fluent-bit[2973]: 2023-12-26T17:42:53.442546812Z node_cpu_seconds_total{cpu="1",mode="idle"} = 202.86000000000001
Dec 26 23:12:54 fedres.stack.com fluent-bit[2973]: 2023-12-26T17:42:53.442546812Z node_cpu_seconds_total{cpu="1",mode="iowait"} = 0.23999999999999999
Dec 26 23:12:54 fedres.stack.com fluent-bit[2973]: 2023-12-26T17:42:53.442546812Z node_cpu_seconds_total{cpu="1",mode="irq"} = 0.17999999999999999
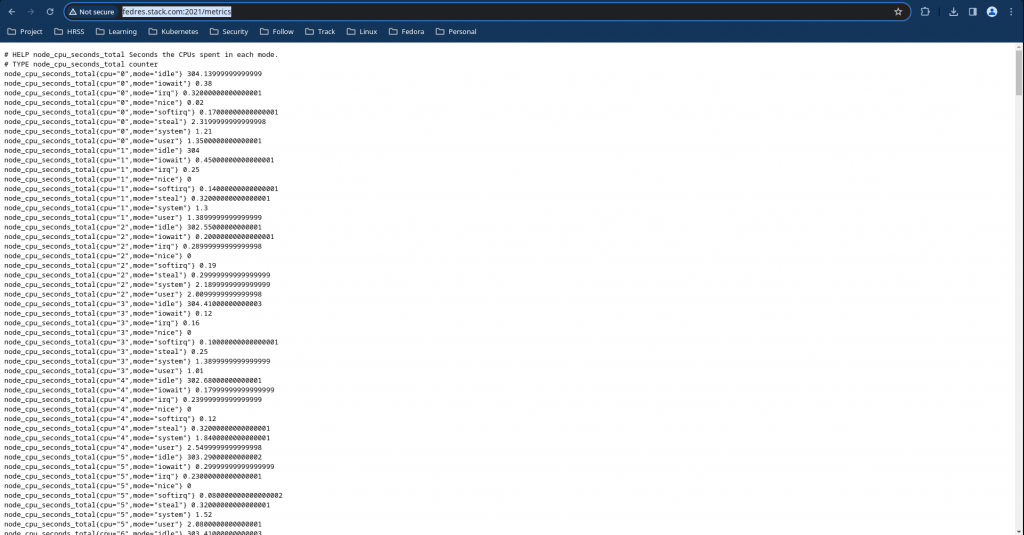
We can also validate the prometheus exposed metrics on port 2021 by accessing the following URL.
URL - http://fedres.stack.com:2021/metrics
Hope you enjoyed reading this article. Thank you..
Leave a Reply
You must be logged in to post a comment.