Raw Metrics to Rich Insights using Prometheus and Grafana
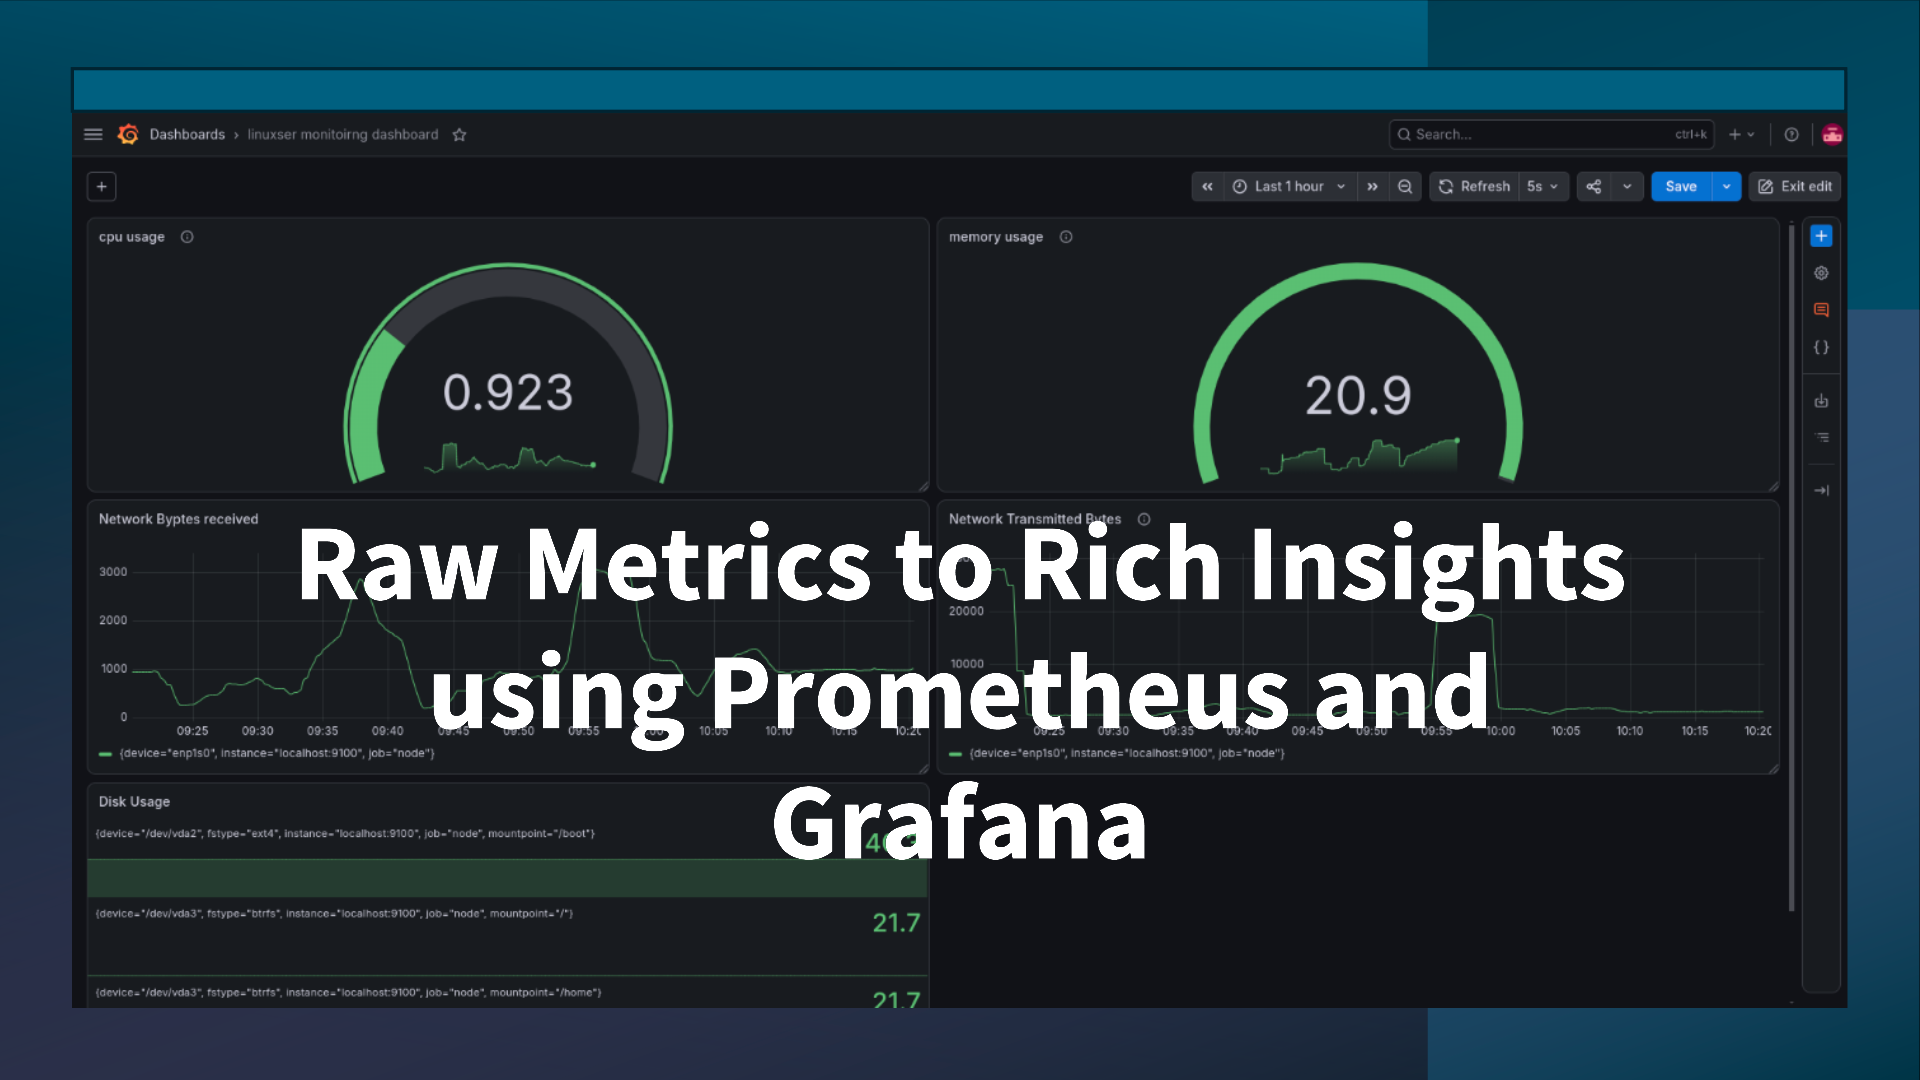
Here in this article we will try to explore how we can leverage prometheus to collect and store metrics from a server in a timeseries database. We will also leverage grafana to query and visualize these metrics through grafana dashboard.
Test Environment
- Fedora 41 server
- Grafana v13.1.1
- Prometheus v3.13.1
- Prometheus Node Exporter v1.12.1
If you are interested in watching the video. Here is the YouTube video on the same step by step procedure outlined below.
Procedure
Step1: Ensure Grafana Installed and Running
As a first step ensure that you have a running instance of grafana on your local machine. You can follow “How to Setup Grafana on Fedora OS” for the same.
Step2: Install Prometheus Node Exporter
Prometheus Node exporter is a widely used tool that exposes system metrics. Once installed and running we can verify the system metrics being exported at the following endpoint “/metrics”.
# Download Node Exporter for Linux AMD x86_64 arch
admin@linuxser:~$ wget https://github.com/prometheus/node_exporter/releases/download/v1.12.1/node_exporter-1.12.1.linux-amd64.tar.gz

# Extract Node Exporter
admin@linuxser:~$ tar -xzvf node_exporter-1.12.1.linux-amd64.tar.gz
node_exporter-1.12.1.linux-amd64/
node_exporter-1.12.1.linux-amd64/node_exporter
node_exporter-1.12.1.linux-amd64/LICENSE
node_exporter-1.12.1.linux-amd64/NOTICE

# Run Node Exporter
admin@linuxser:~$ cd node_exporter-1.12.1.linux-amd64/
admin@linuxser:~/node_exporter-1.12.1.linux-amd64$ ./node_exporter
The system metrics will be available at the following metrics endpoint.
URL: http://linuxser.stack.com:9100/metrics
Step3: Install Prometheus
Node Exporter is a metrics producer that exposes raw text data on its HTTP endpoint (usually http://:9100/metrics). It does not have a database engine or a query language API. For Grafana to visualize the data, it needs to query a database and fetch the data which is only possible if we can store these metrics in some kind of database which grafana can query and visualize.
That’s the reason we need to install Prometheus so that it can collect these metrics and store it in a database (in this case a timeseries database) which can be queried.
# Download Prometheus
admin@linuxser:~$ wget https://github.com/prometheus/prometheus/releases/download/v3.13.1/prometheus-3.13.1.linux-amd64.tar.gz

# Extract Prometheus
admin@linuxser:~$ tar -xvzf prometheus-3.13.1.linux-amd64.tar.gz
prometheus-3.13.1.linux-amd64/
prometheus-3.13.1.linux-amd64/LICENSE
prometheus-3.13.1.linux-amd64/prometheus.yml
prometheus-3.13.1.linux-amd64/promtool
prometheus-3.13.1.linux-amd64/prometheus
prometheus-3.13.1.linux-amd64/NOTICE

# Switch to Prometheus extracted directory
admin@linuxser:~$ cd prometheus-3.13.1.linux-amd64/
Step4: Configure Prometheus to collect system metrics
Here we need to configure the prometheus.yml file to scrape the metrics from the Node exporter metrics endpoint (ie. localhost:9100).
admin@linuxser:~/prometheus-3.13.1.linux-amd64$ cat prometheus.yml
global:
  scrape_interval: 15s

scrape_configs:
- job_name: node
  static_configs:
  - targets: ['localhost:9100']
Step5: Run Prometheus
Once you have updated the prometheus.yml configuration file with the target node to scrape metrics, we can start our prometheus instance.
admin@linuxser:~/prometheus-3.13.1.linux-amd64$ ./prometheus --config.file=./prometheus.yml
Now you can verify the target server health status using the below url which validates that prometheus is able to scrape the metrics from the node exporter endpoint.
URL: http://linuxser.stack.com:9090/targets

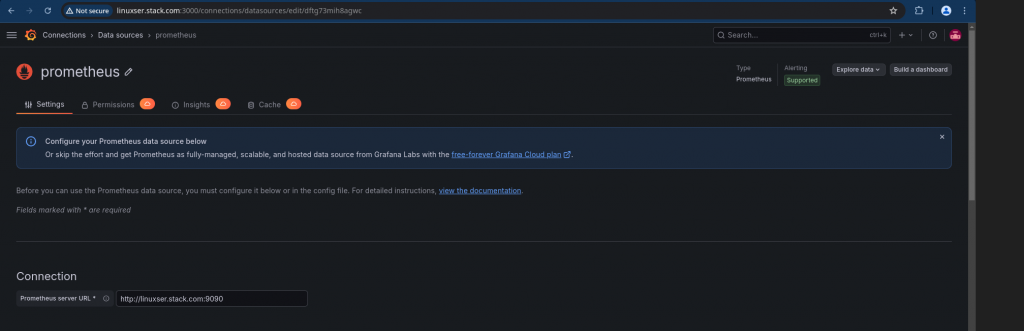
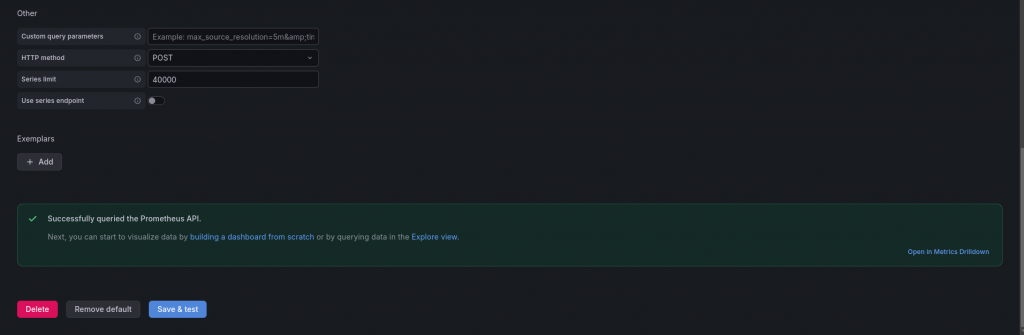
Step6: Configure Grafana Prometheus datasource
Here we are going to configure the prometheus datasource within grafana dashboard and verify the connection as shown below.
Step7: Create a Grafana Dashboard
Before we can create a grafana dashboard we need to prepare our promql queries for the metrics that we want to monitor.
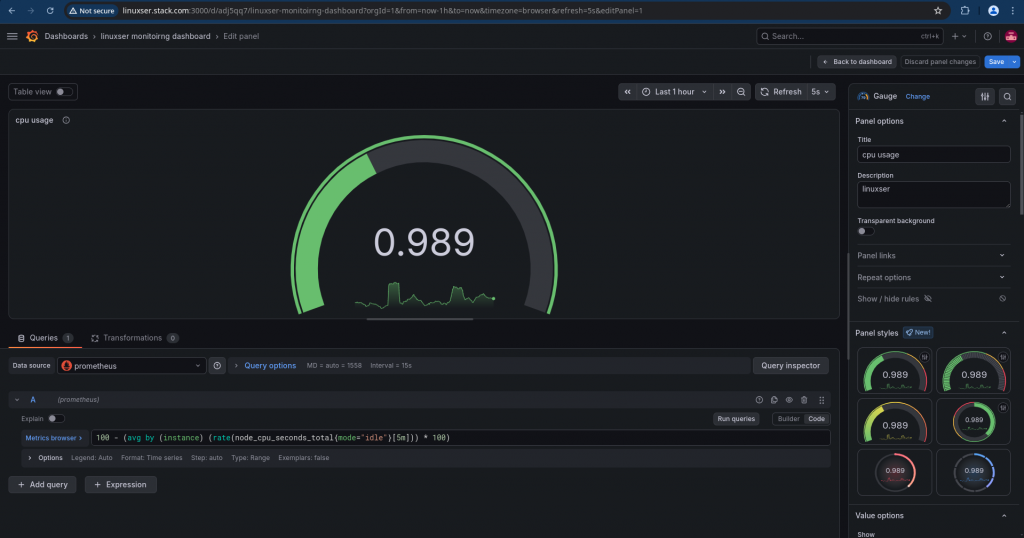
We can build our query using the grafana query builder available within the panel that we add to dashboar or we can copy the query to execute directly into the code block. Here we are going to use the code block to copy our prepared query directly.
So here are some queries which we can leverage to get some server statistics.
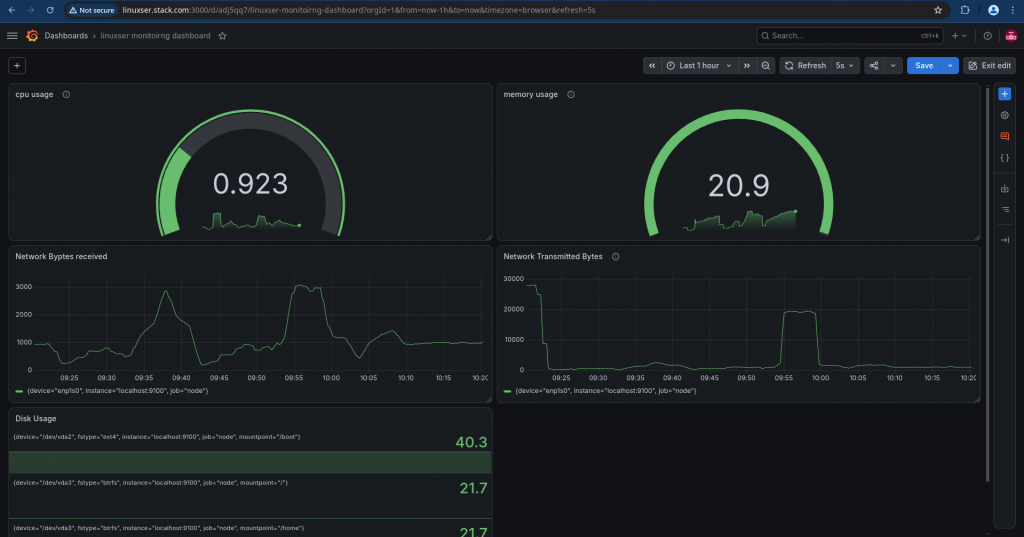
- CPU Usage: 100 – (avg by (instance) (rate(node_cpu_seconds_total{mode=”idle”}[5m])) * 100)
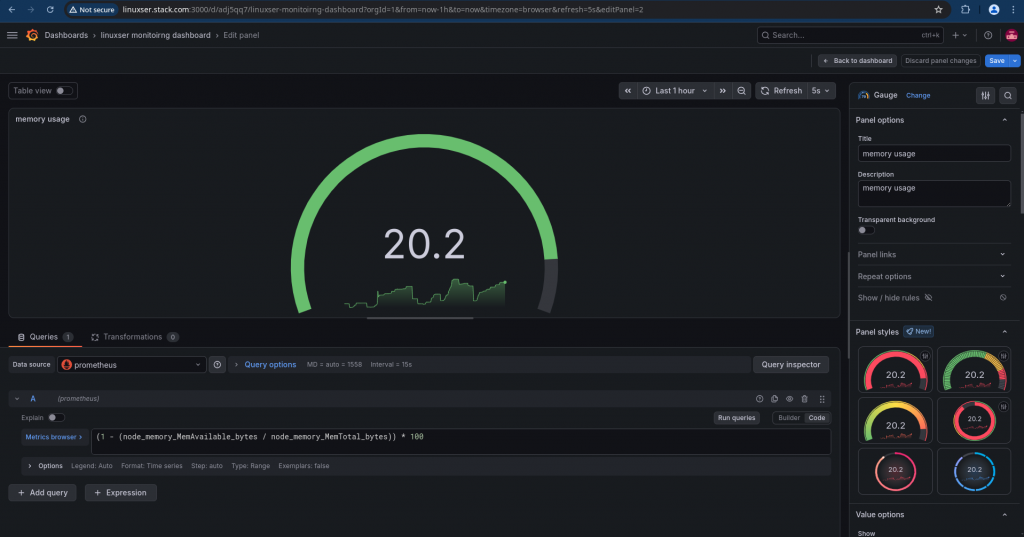
- Memory Usage: (1 – (node_memory_MemAvailable_bytes / node_memory_MemTotal_bytes)) * 100
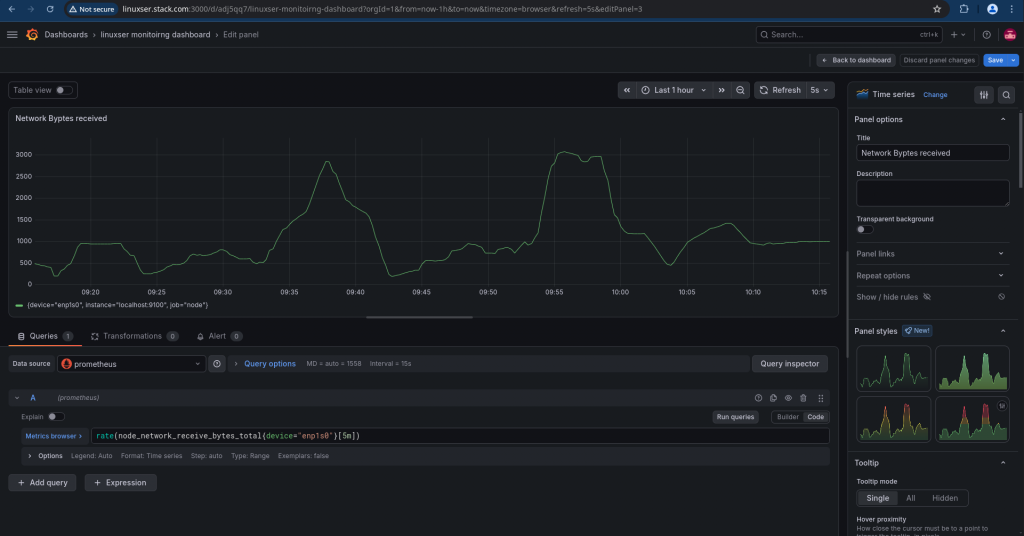
- Network Bytes Received: rate(node_network_receive_bytes_total{device=”enp1s0″}[5m])
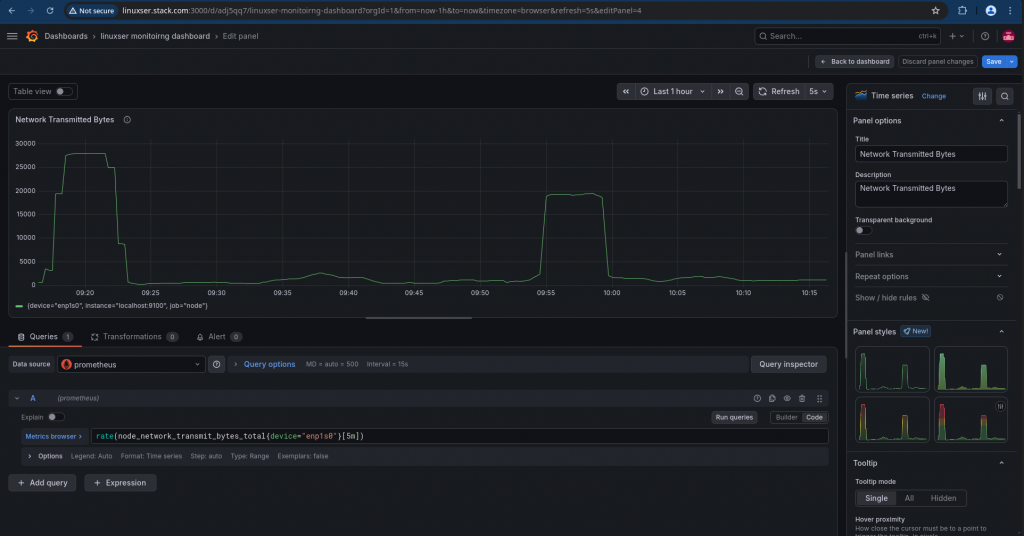
- Network Bytes Transmitted: rate(node_network_transmit_bytes_total{device=”enp1s0″}[5m])
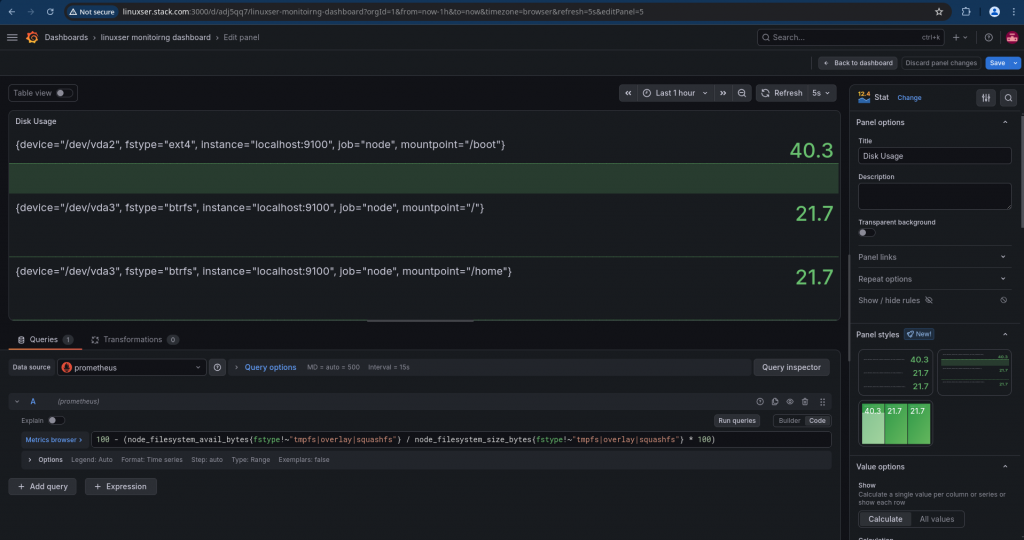
- Disk Usage: 100 – (node_filesystem_avail_bytes{fstype!”tmpfs|overlay|squashfs”} / node_filesystem_size_bytes{fstype!”tmpfs|overlay|squashfs”} * 100)
Here is the complete dashboard with all the above panel included.
Hope you enjoyed reading this article. Thank you..



Related Posts