Instrument Application using Grafana Beyla an eBPF Application

Here in this article we will try to understand how we can leverage an eBPF based application to instrument target application to collect metrics without any modification in the code.
Test Environment
- Fedora 41 server
- Docker v28.5.2
- Docker Compose v5.1.0
What is Grafana Beyla
Grafana Beyla is an eBPF (ie. Extended Berkeley Packet Filter) based application that can instrument the target application or service without any code changes. It can capture the Rate, Error and Duration (ie. RED metrics) and traces for your services. These metrics can further be exported in either OpenTelemetry or Prometheus formats.
Beyla instruments services written in Go, Java, .NET, Node.js, Python, Ruby, Rust, C/C++, and more. Beyla observes requests at the kernel level, so it can also instrument services that don’t have an OpenTelemetry or Prometheus SDK.
Beyla is the Grafana Labs distribution of OpenTelemetry eBPF Instrumentation (OBI).
Grafana Beyla vs Language SDK or Agents
The standard approach that is followed for application observability is usually done by.
- Injecting some code within the application source code to collect metrics and traces data.
- Launching the application with some kind of instrumentation agent or SDK that is available for that particular language in which the application is written.
It is not always possible to have an Agent SDK available for each language and that is where Beyla can help with application observability. It can capture RED metrics and trace spans for HTTP/S and gRPC services, and for database and messaging clients such as SQL, Redis, Kafka, and MongoDB.
Also another possible issue with language SDK or Agents is once the application is instrumented using these libraries they become a part of your application dependencies and any vulnerabilities in an instrumentation library becomes a vulnerability in your application.
Beyla doesn’t add a dependency to your application. Beyla runs as a separate process, and its eBPF programs run in the kernel, outside your application process memory. Also the kernel verifies every eBPF program before it runs, so a faulty eBPF program can’t.
Beyla observes requests at the kernel network level, and in the Go runtime for Go applications. The latency that Beyla reports includes queue time, so it’s closer to what the client sees.
In environments with many languages, a practical pattern is to run Beyla on every service, and add SDKs where you need more detail. Use Beyla and SDKs together when you want:
- Beyla to provide baseline metrics and service graphs.
- SDKs to provide deep traces, log correlation, runtime metrics, or custom telemetry on the services that need them.
Grafana Beyla Workflow
eBPF is a Linux kernel technology that runs small, sandboxed programs inside the kernel. These programs can observe system calls and the network stack, and can attach to functions inside running applications through user space probes, also known as uprobes.
- Kernel probes: Capture network activity, such as connections, reads, and writes, and Beyla filters the events by process.
- User space probes Attach to functions in the language runtime or libraries of the process, for example in Go applications.
Beyla is the user space program that loads its eBPF programs into the kernel and collects the data they produce. Beyla and its eBPF programs exchange data through eBPF maps, such as ring buffers and hash maps.
High Level Architecture
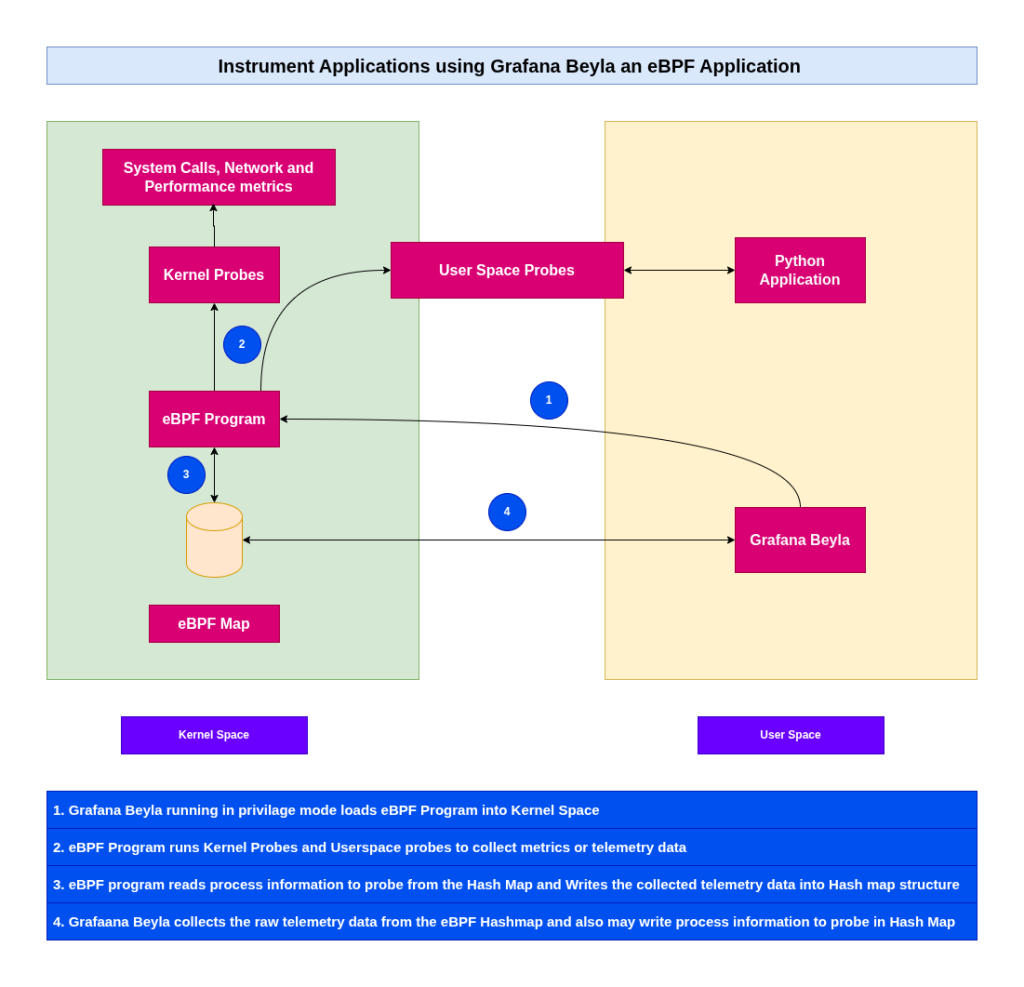
If you are interested in watching the video. Here is the YouTube video on the same step by step procedure outlined below.
Procedure
Step1: Ensure eBPF supported on Host Kernel
Beyla requires Linux kernel 5.8 or later, with BPF Type Format (BTF) enabled. To check whether your kernel has BTF enabled, verify that /sys/kernel/btf/vmlinux exists.
# Check kernel version
admin@linuxser:~$ uname -r
6.17.10-100.fc41.x86_64

# Check eBPF support
admin@linuxser:~$ ls -ltr /sys/kernel/btf/vmlinux
-r--r--r--. 1 root root 6669747 Nov  6 09:43 /sys/kernel/btf/vmlinux
Step2: Ensure Docker installed and running
As a first step ensure that you have docker installed and running on your machine. Follow “Install Docker Engine on Fedora” for the same.
# Check docker version
admin@linuxser:~$ docker --version
Docker version 28.5.2, build ecc6942

# Check docker compose version
admin@linuxser:~$ docker compose version
Docker Compose version v5.1.0

# Ensure docker service started
admin@linuxser:~$ sudo systemctl start docker.service
admin@linuxser:~$ sudo systemctl status docker.service
Step3: Instantiate Target dockerized application
Here i am going to setup an application using python flask as a sample target application which we are going to instrument using the Grafana Beyla.
# Clone flask application
admin@linuxser:~$ git clone https://github.com/novicejava1/python-web-application.git

admin@linuxser:~$ cd python-web-application/
admin@linuxser:~/python-web-application$ docker build -t pythonwebapp:1.0 .

admin@linuxser:~/python-web-application$ docker images | grep pythonwebapp
pythonwebapp                             1.0           854fdc5359e1   28 seconds ago   134MB
Here is the docker compose file with OTEL_RESOURCE_ATTRIBUTES environment variable set at the application level. This resource attributes help us to identify the application, they act like metadata.
NOTE: On OTel side the standard resource attributes use dots as separators.
admin@linuxser:~/python-web-application$ cat docker-compose.yml
services:
  web:
    image: pythonwebapp:1.0
    container_name: python-web-app
    environment:
      - OTEL_RESOURCE_ATTRIBUTES=deployment.environment=development
    ports:
      - "5000:5000"
Validate the python flask application.
URL: http://linuxser.stack.com:5000/
Step4: Instantiate Grafana Beyla docker service
Here we are going to setup Grafana Beyla service as a docker container. As Grafana Beyla requires to load eBPF programs into the host kernel, this container needs elevated privieges so we need to start this container in privileged mode, or grant only the Linux capabilities that are needed for your usecase.
Beyla also needs to see the process it instruments (ie. Target application). So we need to share the PID namespace of the target container (ie. container:python-web-app) with the Beyla container.
Here is the docker compose file for Grafana Beyla service.
admin@linuxser:~/grafana-beyla$ cat docker-compose.yml
services:
  beyla:
    image: grafana/beyla:latest
    container_name: beyla
    # Shares the process ID namespace of the target container
    pid: "container:python-web-app"
    # Essential for eBPF to access kernel probes
    privileged: true
    # Publish Prometheus Port for metrics
    ports:
      - "9100:9100"
    environment:
      # Instructs Beyla to look for a process exposing this port inside the namespace
      BEYLA_OPEN_PORT: 5000
      # Expose Prometheus Port for metrics
      BEYLA_PROMETHEUS_PORT: 9100
      # Resource attributes
      BEYLA_PROMETHEUS_EXTRA_RESOURCE_ATTRIBUTES: deployment_environment
      # Prints traces directly to the container log for verification
      # BEYLA_TRACE_PRINTER: text
NOTE: On Beyla side prometheus labels cannot contain dots. They are restricted to alphanumeric characters and underscores. So beyla sanitizes these environment variables by converting dots to underscore (ie. deployment.environment becomes deployment_environment).
Let’s now instantiate the Grafana Beyla docker service.
admin@linuxser:~/grafana-beyla$ docker compose up -d
Verify grafana beyla service is running.
admin@linuxser:~/grafana-beyla$ docker ps
CONTAINER ID   IMAGE                  COMMAND                  CREATED          STATUS          PORTS                                         NAMES
46e7ab753648   grafana/beyla:latest   "/beyla"                 5 minutes ago    Up 5 minutes    0.0.0.0:9100->9100/tcp, [::]:9100->9100/tcp   beyla
f1c27eb3827f   pythonwebapp:1.0       "gunicorn --bind 0.0…"   37 minutes ago   Up 37 minutes   0.0.0.0:5000->5000/tcp, [::]:5000->5000/tcp   python-web-app
Step5: Trigger requests to Python Application
Here we are going to trigger some requests to the python application.
Homepage: http://linuxser.stack.com:5000/
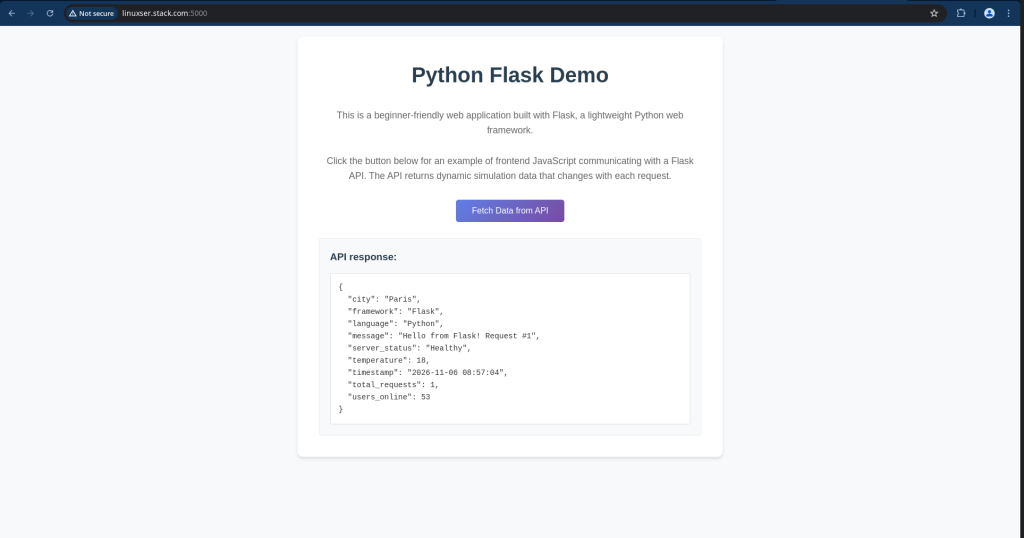
API: http://linuxser.stack.com:5000/api/data
admin@linuxser:~/grafana-beyla$ curl http://linuxser.stack.com:5000/api/data
{"city":"Sydney","framework":"Flask","language":"Python","message":"Hello from Flask! Request #10","server_status":"Busy","temperature":23,"timestamp":"2026-11-06 09:00:28","total_requests":10,"users_online":369}
Step6: Validate Prometheus metrics endpoint
Now that we have triggered some requests to the python application it should expose its metrics on the metrics endpoint as shown below.
URL: http://linuxser.stack.com:9100/metrics
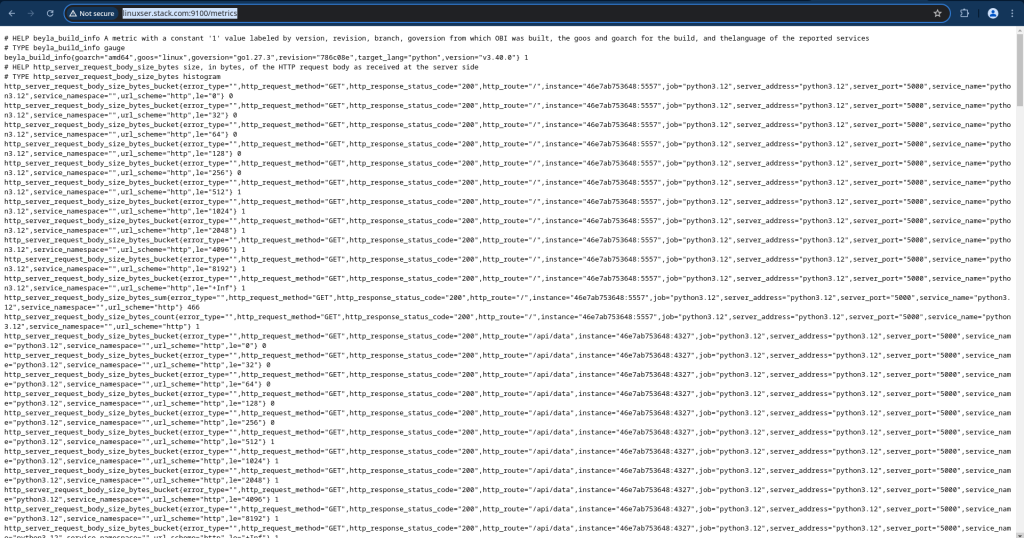
Step7: Scrape metrics using Prometheus service
Now, we will instantiate the prometheus services as a docker container with a custom “prometheus.yml” file volume mounted which defines the target endpoint to scrape (ie. linuser.stack.com:9100) in this case which is a python web application.
admin@linuxser:~/prometheus$ cat docker-compose.yml
services:
  prometheus:
    image: prom/prometheus:v2.47.0
    command:
      - --config.file=/etc/prometheus/prometheus.yml
    ports:
      - "9090:9090"
    volumes:
      - ./prometheus.yml:/etc/prometheus/prometheus.yml
admin@linuxser:~/prometheus$ cat prometheus.yml
global:
  scrape_interval: 15s

scrape_configs:
- job_name: pythonwebapp
  static_configs:
  - targets: ['linuxser.stack.com:9100']
    labels:
      name: "pythonwebapp"
      environment: "development"
Let’s instantiate the prometheus service to scrape metrics exposed on port 9100 for python web application.
admin@linuxser:~/prometheus$ docker compose up -d
Validate the python web application metrics target endpoint is getting scraped successfully by prometheus.
URL: http://linuxser.stack.com:9090/targets
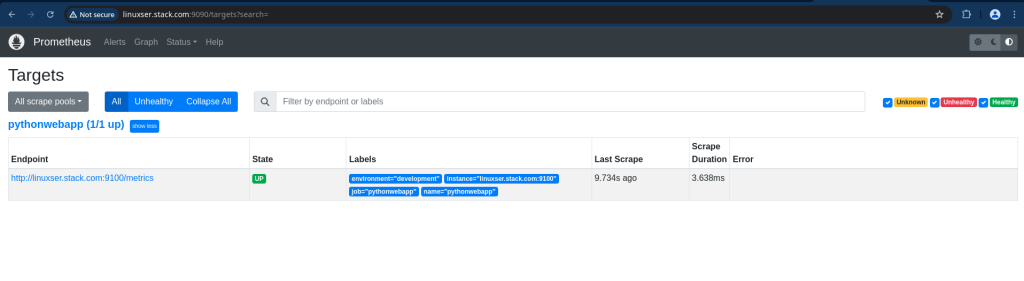
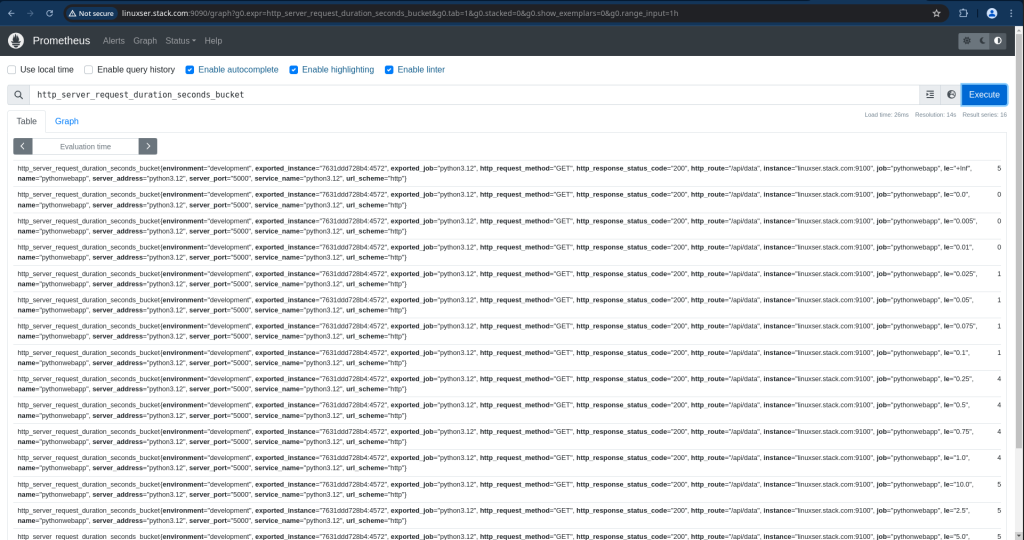
We can now use prometheus portal to query the timeseries database for the metrics or export them further to Grafana for further analysis.
Hope you enjoyed reading this article. Thank you..



Related Posts