How to setup Python application profiling using Pyroscope SDK

Here in this article we will take a sample python flask application and enable profiling using the Pyroscope SDK to capture performance profiling data. We will further leverage Grafana Pyroscope to aggregrate this data and visualize using Grafana.
Test Environment
- Fedora 44 server
- Grafana v13.1.1
- Grafana Alloy v1.20.1
- Grafana Pyroscope v2.3.1
What is Profiling
Profiling a program helps developers to identify to identify parts of the program that are consuming the most resources, such as CPU time, memory, or I/O operations. This collected information can further be used to optimize the program and make it run faster or with less memory footprint.
There are primarily three types of profiling.
- Traditional or Sample-based profiling: In this method the profiler interrupts the program at regular intervals, capturing the program’s state each time. By analyzing these snapshots, developers can deduce the frequency at which parts of the code execute.
- Instrumentation-based profiling: In this method developers insert additional code into the program that records information about its execution. This approach provides detailed insights but can alter the program’s behavior due to the added code overhead.
- Continuous profiling: In this method profiling data is continuously collected in the background with minimal overhead. This method is suitable for distributed applications that are running 24*7 in production environment. By doing so, developers gain a more comprehensive view of a program’s behavior over time, helping to identify sporadic or long-term performance issues.
What is Grafana Pyroscope
Grafana Pyroscope is a database. Specifically, it is an open-source, horizontally scalable continuous profiling database designed to ingest, store, and aggregate massive amounts of application performance data down to the specific line of code.
It helps to deep dive into the performance attributes and resource demands of the applications that have been enabled with continious profiling.
Pyroscope transforms raw profiling data into readily actionable insights. We can leverage Pyroscope UI or Grafana to visualize the performance profiling data.
Supported Profiling Types
- CPU profiling: CPU profiling measures the amount of CPU time consumed by different parts of your application code. High CPU usage can indicate inefficient code, leading to poor performance and increased operational costs. It’s used to identify and optimize CPU-intensive functions in your application.
- Memory allocation profiling: Memory allocation profiling tracks the amount and frequency of memory allocations by the application. Excessive or inefficient memory allocation can lead to memory leaks and high garbage collection overhead, impacting application efficiency.
- Goroutine profiling: Goroutines are lightweight threads in Go, used for concurrent operations. Goroutine profiling measures the usage and performance of these threads. Poor management can lead to issues like deadlocks and excessive resource usage.
- Mutex profiling: Mutex profiling involves analyzing mutex (mutual exclusion) locks, used to prevent simultaneous access to shared resources. Excessive or long-duration mutex locks can cause delays and reduced application throughput.
- Block profiling: Block profiling measures the frequency and duration of blocking operations, where a thread is paused or delayed. Blocking can significantly slow down application processes, leading to performance bottlenecks.
What are Flame Graphs
A fundamental aspect of continuous profiling is the flame graph, a convenient way to visualize performance data. These graphs provide a clear, intuitive understanding of resource allocation and bottlenecks within the application.
Horizontally, the flame graph represents 100% of the time that this application was running. The width of each node represents the amount of time spent in that function. The wider the node, the more time spent in that function. The narrower the node, the less time spent in that function.
Vertically, the nodes in the flame graph represent the hierarchy of functions called and time spent in each function.
What is Pyroscope SDK
Pyroscope SDKs offer you the ability to instrument your application directly for more precise profiling. Use the SDKs when you want complete control over the profiling process or when the application you are profiling is written in a language supported by the SDKs (for example, Java, Python, .NET, and others).
High Level Architecture
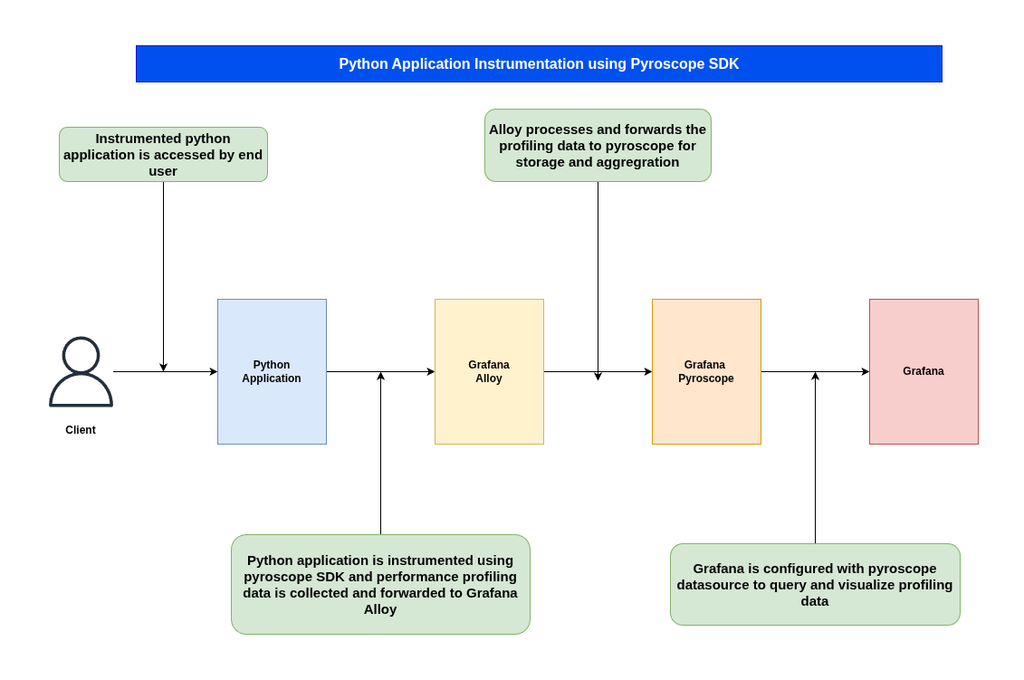
If you are interested in watching the video. Here is the YouTube video on the same step by step procedure outlined below.
Procedure
Step1: Ensure Grafana repository enabled
As a first step let’s download and import and grafana gpg key and setup the grafana repository.
# Download and Import GPG key
admin@linuxser:~$ wget -q -O gpg.key https://rpm.grafana.com/gpg.key
admin@linuxser:~$ sudo rpm --import gpg.key

# Setup Grafana Repository
admin@linuxser:~$ echo -e '[grafana]\nname=grafana\nbaseurl=https://rpm.grafana.com\nrepo_gpgcheck=1\nenabled=1\ngpgcheck=1\ngpgkey=https://rpm.grafana.com/gpg.key\nsslverify=1\nsslcacert=/etc/pki/ca-trust/extracted/pem/tls-ca-bundle.pem' | sudo tee /etc/yum.repos.d/grafana.repo
[grafana]
name=grafana
baseurl=https://rpm.grafana.com
repo_gpgcheck=1
enabled=1
gpgcheck=1
gpgkey=https://rpm.grafana.com/gpg.key
sslverify=1
sslcacert=/etc/pki/ca-trust/extracted/pem/tls-ca-bundle.pem
Step2: Ensure Grafana service installed and running
Here we will install the grafana rpm package from the repository and start up the service with the default settings enabled.
# Install Grafana
admin@linuxser:~$ sudo dnf install grafana

# Start Grafana
admin@linuxser:~$ sudo systemctl daemon-reload
admin@linuxser:~$ sudo systemctl start grafana-server.service
admin@linuxser:~$ sudo systemctl status grafana-server.service
Now let’s, validate the service using the below url.
URL: http://linuxser.stack.com:3000/
Step3: Ensure Grafana Alloy installed and running
Let’s now install Grafana Alloy package and update its configuration such that it collects the profiling data sent using the Python Pyroscope SDK used to instrument the application.
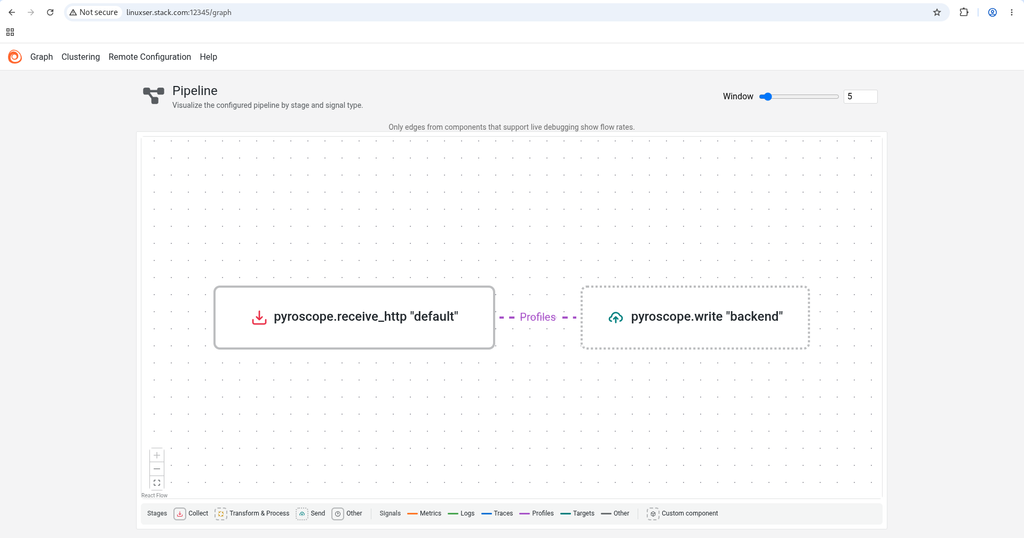
Here the profiling data as received by the instrumented python application is collected over port “9999” and forwarded to the backend pyroscope store on port “4040”.
We are also enabling the livedebugging feature with the alloy configuration so that we can capture the trace data that is collected and forwarded through the grafana alloy if any.
admin@linuxser:~$ sudo dnf install alloy
admin@linuxser:~$ sudo cat /etc/alloy/config.alloy
// Receives profiles over HTTP
pyroscope.receive_http "default" {
   http {
       listen_address = "0.0.0.0"
       listen_port = 9999
   }
   forward_to = [pyroscope.write.backend.receiver]
}

// Forwards profiles to Pyroscope
pyroscope.write "backend" {
   endpoint {
       url = "http://127.0.0.1:4040"
   }
}

livedebugging {
  enabled = true
}
In order to visualize the data pipeline we need to enable the following HTTP listner port as shown below.
admin@linuxser:~$ sudo cat /etc/sysconfig/alloy | grep -i custom_args
CUSTOM_ARGS="--server.http.listen-addr=0.0.0.0:12345"
Now let’s start up the grafana alloy service and verify its status.
admin@linuxser:~$ sudo systemctl start alloy.service
admin@linuxser:~$ sudo systemctl status alloy.service
URL: http://linuxser.stack.com:12345/graph
Step4: Ensure Grafana Pyroscope installed and running
Here we ware now going to install the pyroscope rpm package from the grafana repository and start up the service using the default settings.
admin@linuxser:~$ sudo dnf install pyroscope

admin@linuxser:~$ sudo systemctl daemon-reload
admin@linuxser:~$ sudo systemctl start pyroscope.service
admin@linuxser:~$ sudo systemctl status pyroscope.service
Let’s validate that the pyroscope serivce up and running.
admin@linuxser:~$ curl localhost:4040/ready
ready
Step5: Instrument Python Application using Pyroscope SDK
Now, let’s create a directory to setup python virtual environment and activate it to install the pyroscope and other python flask dependent packages.
admin@linuxser:~$ mkdir profiledemo
admin@linuxser:~$ cd profiledemo/
admin@linuxser:~/profiledemo$ python -m venv venv
admin@linuxser:~/profiledemo$ source venv/bin/activate

(venv) admin@linuxser:~/profiledemo$
(venv) admin@linuxser:~/profiledemo$ pip install pyroscope-io
(venv) admin@linuxser:~/profiledemo$ pip install flask requests
Let’s create the below python flask application instrumented using the pyroscope pacakage with its respective configuration.
In pyroscope.configure, we have configured the application name, server address receving the profiling data (ie. alloy in this case) and we have set cpu_enabled and mem_enabled to true to enable profiling for both cpu and memory.
The flask applicaiton has two context requests served by two different function. One is fast_request() and other is slow_request().
If your profiling is done correctly, you should be able to see the slow_request() occupying more number of cpu cycles or memory footprint to serve the slow_request().
admin@linuxser:~/profiledemo$ cat resourceintensiveapp.py
import pyroscope
import time
from flask import Flask, request

app = Flask(__name__)

pyroscope.configure(
  application_name = "my.python.app", # replace this with some name for your application
  server_address   = "http://127.0.0.1:9999", # replace this with the address of your Pyroscope server
  sample_rate           = 100, # default is 100
  cpu_enabled           = True, # enable CPU profiling; default is True
  oncpu                 = True, # report cpu time only; default is True
  gil_only              = True, # only include traces for threads that are holding on to the Global Interpreter Lock; default is True
  mem_enabled           = True, # enable memory profiling; default is False
  mem_max_nframe        = 128, # maximum number of frames in memory allocation stack traces; default is 128
  mem_heap_sample_size  = 512 * 1024, # average number of bytes between memory samples; default is 512 KiB
  mem_enable_mem_domain = True, # include the Python memory allocator domain on Python 3.12 and later; default is True
  enable_logging        = True, # does enable logging facility; default is False
  tags={
    "env": "development",
    "version": "1.0.0",
  },
)

@app.route("/fast_request")
def fast_request():
    print(request.args.get("param"))
    return "served"

@app.route("/fast_request")
def slow_request():
    print(request.args.get("param"))
    for i in range(1000):
        time.sleep(30)
        print("Trying to serve request")
    return "served"


if __name__ == "__main__":
    app.run(port=8082)
Step6: Run Application
Here we will run our python application to serve the “/fast_request” and “/slow_request” contexts as shown below.
(venv) admin@linuxser:~/profiledemo$ python resourceintensiveapp.py
Let’s now try to access our application by hitting the following contexts.
NOTE: The /slow_request is going to take a long time to be served.
admin@linuxser:~$ curl http://localhost:8082/fast_request?param=hello
servedadmin@linuxser:~$ curl http://localhost:8082/fast_request
servedadmin@linuxser:~$ curl http://localhost:8082/fast_request
servedadmin@linuxser:~$ curl http://localhost:8082/fast_request
servedadmin@linuxser:~$ curl http://localhost:8082/fast_request
servedadmin@linuxser:~$ curl http://localhost:8082/fast_request?param=hello
servedadmin@linuxser:~$ curl http://localhost:8082/fast_request?param=hello
servedadmin@linuxser:~$ curl http://localhost:8082/fast_request?param=hello
servedadmin@linuxser:~$ curl http://localhost:8082/fast_request?param=hello
servedadmin@linuxser:~$ curl http://localhost:8082/slow_request
Step7: Configure Grafana Pyroscope datasource
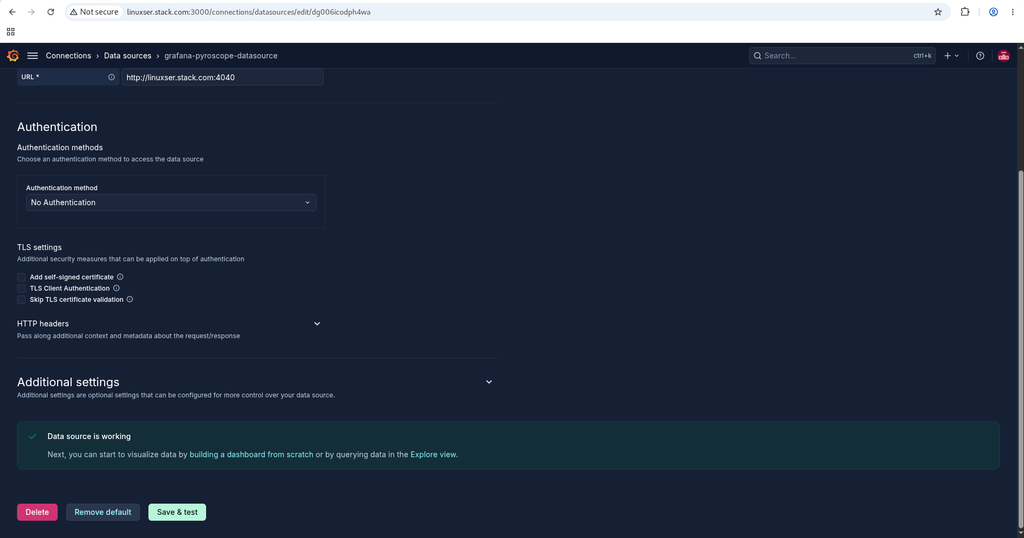
Now that we have the profiling data available in the pyroscope aggregration system. Let’s configure the pyroscope datasource as shown below in Grafana and validate the connection.
Step8: Validate Profiling data
It’s time to now validate our python application’s performance profiling data.
Navigate to Grafana Portal – Drill Down – Profiles and you should be on the langing page of profiles for list of all the services that pyroscope is currently receiving profiling data.
By default pyroscope gets profiling data about itself under the service name “pyroscope”. The other service is “my.python.app” is our custom python flask application that we just executed above.
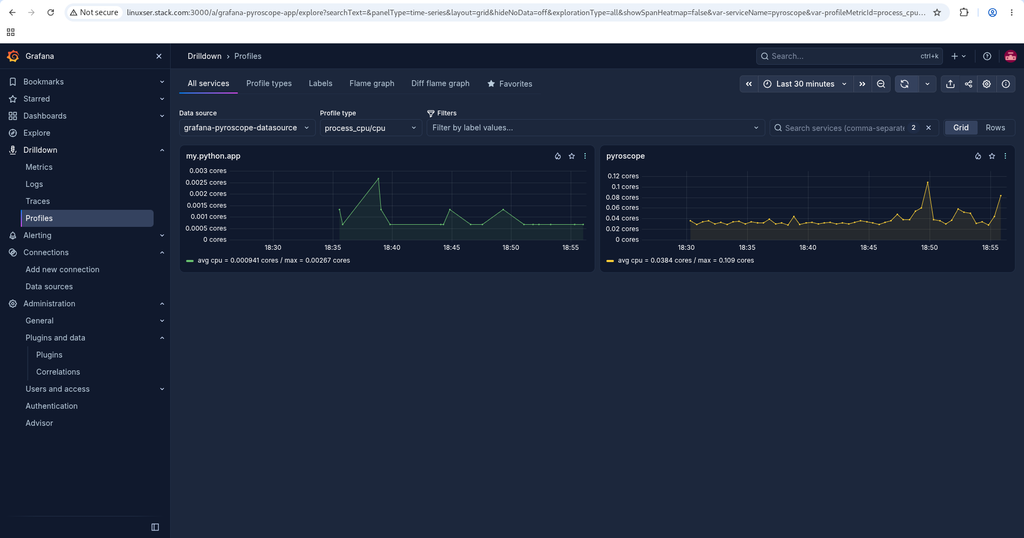
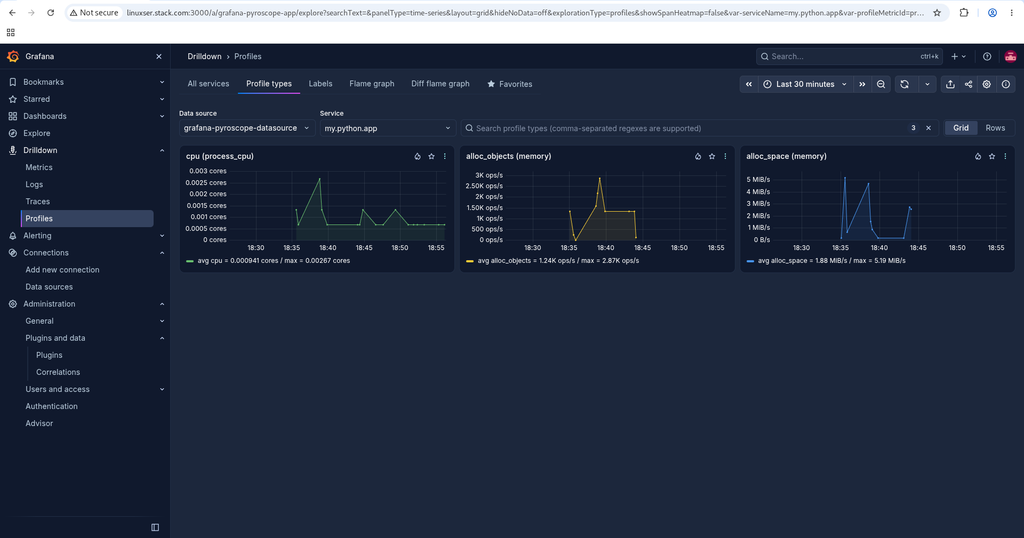
Also we can get specific service profiling type data using the “Profiles types” page as shown below.
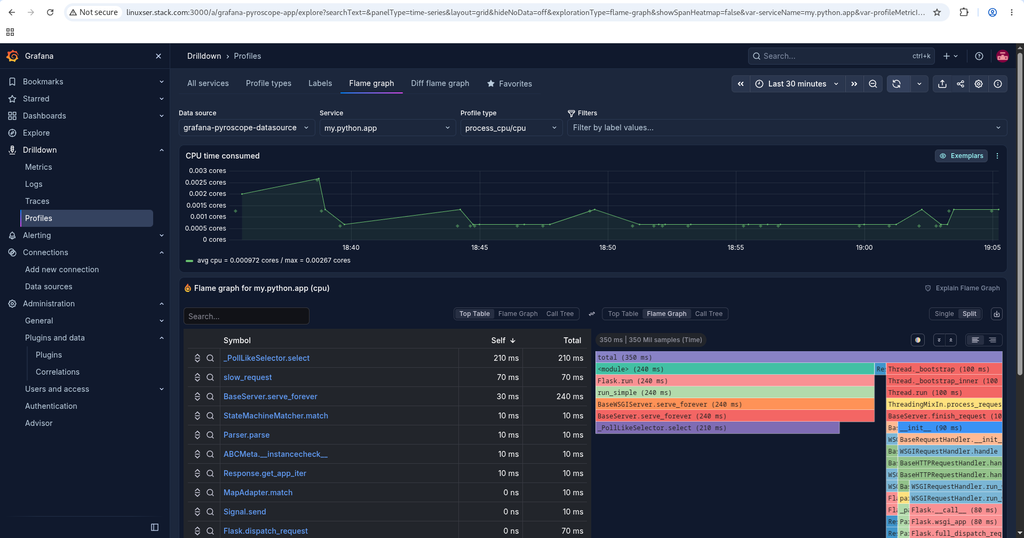
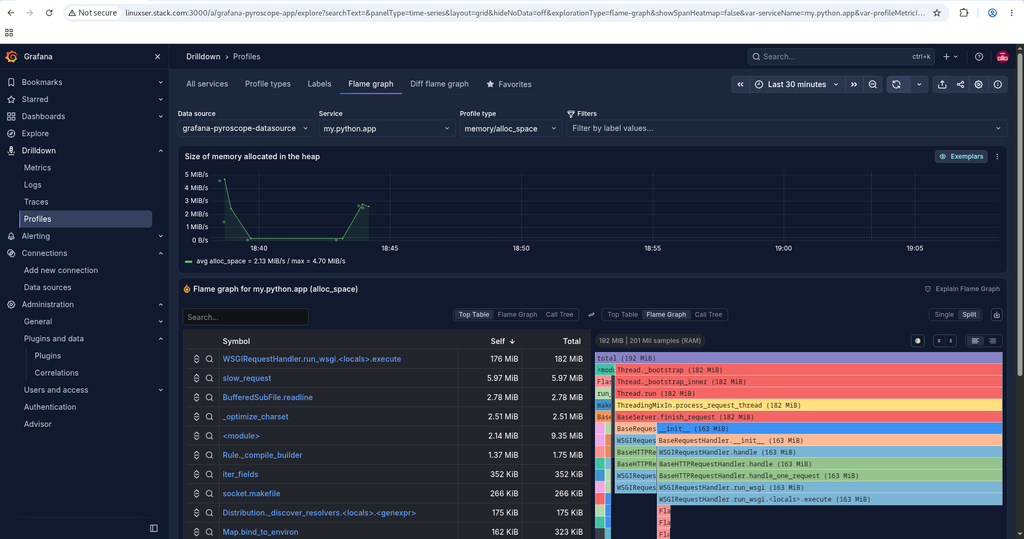
The most important tab is the “Flame graph” page which provides useful information on the CPU and memory resource allocation by respective function calls within the applications.
Hope you enjoyed reading this article. Thank you..



Related Posts