Grafana Git Sync to Synchronize resouces

Here in this article we will try to understand about Grafana Git Sync feature to synchronize resources between git provider and grafana.
Test Environment
- Fedora 41 server
- Grafana v13.1.1
- Prometheus v3.13.1
- Prometheus Node Exporter v1.12.1
Git Sync
Git Sync in Grafana lets you synchronize your resources so you can store your dashboards as JSON files in any Git provider and manage them as code. You and your team can version control, collaborate, and automate deployments efficiently.
The synchronization is bidirectional. You can modify provisioned resources both from the Grafana UI or from the synced repository, and changes will be reflected in both places.
Git Sync is available for any Git provider through a Pure Git repository type, and has specific enhanced integrations for GitHub, GitLab and Bitbucket.
If you are interested in watching the video. Here is the YouTube video on the same step by step procedure outlined below.
Procedure
Step1: Ensure Grafana installed and Running
As a first step ensure that you have a secure instance of grafana running. You can Follow “How to secure Grafana using SSL certificate” for the same.
Step2: Ensure GitLab installed and Running
Here we are going to setup a secure gitlab instance using the docker compose file as shown below.
First let’s create the following directory structure to persist data.
admin@linuxser:~$ mkdir -p ~/gitlab-docker/config ~/gitlab-docker/logs ~/gitlab-docker/data ~/gitlab-docker/ssl
admin@linuxser:~$ cd ~/gitlab-docker
Now, let’s create a docker compose file as shown below with SSL certificates loaded into the container.
services:

  gitlab:
    image: gitlab/gitlab-ce:latest
    hostname: "linuxser.stack.com"
    logging:
      driver: "json-file"
      options:
        max-size: "100m"
        max-file: "5"
    ports:
    - "443:443"
    - "80:80"
    volumes:
    - "~/gitlab-docker/config:/etc/gitlab"
    - "~/gitlab-docker/logs:/var/log/gitlab"
    - "~/gitlab-docker/data:/var/opt/gitlab"
    - "~/gitlab-docker/ssl/gitlab_cert.pem:/etc/gitlab/gitlab_cert.pem"
    - "~/gitlab-docker/ssl/gitlab_key.pem:/etc/gitlab/gitlab_key.pem"
    - "~/gitlab-docker/ssl/gitlab.rb:/etc/gitlab/gitlab.rb"
Let’s generate the self sign certificates for the gitlab instance.
admin@linuxser:~/gitlab-docker$ cd ssl
admin@linuxser:~/gitlab-docker/ssl$ /usr/bin/sscg --lifetime=365 --country=IN --state=Maharashtra --locality=Mumbai --organization="Stack Inc." --organizational-unit="Stack" --hostname="linuxser.stack.com" --subject-alt-name linuxser.stack.com --key-strength=2048 --hash-alg="sha256" --ca-file=ca.pem --cert-key-file=gitlab_key.pem --cert-file=gitlab_cert.pem --cert-mode=0644 --cert-key-mode=0600
Wrote service certificate key to /home/admin/gitlab-docker/ssl/gitlab_key.pem
Wrote service certificate to /home/admin/gitlab-docker/ssl/gitlab_cert.pem
Wrote CA certificate to /home/admin/gitlab-docker/ssl/ca.pem
Now let’s update the gitlab.rb configuration file to update the SSL settings and assign a initial root password for our gitlab root user as shown below.
admin@linuxser:~/gitlab-docker/ssl$ grep -v "^#" gitlab.rb | sed '/^$/d'
external_url 'https://linuxser.stack.com'
gitlab_rails['initial_root_password'] = "Secure@123321"
nginx['redirect_http_to_https'] = true
nginx['redirect_http_to_https_port'] = 80
nginx['ssl_certificate'] = "/etc/gitlab/gitlab_cert.pem"
nginx['ssl_certificate_key'] = "/etc/gitlab/gitlab_key.pem"
We can now validate that the gitlab instance is listening on secure channel.
URL: https://linuxser.stack.com
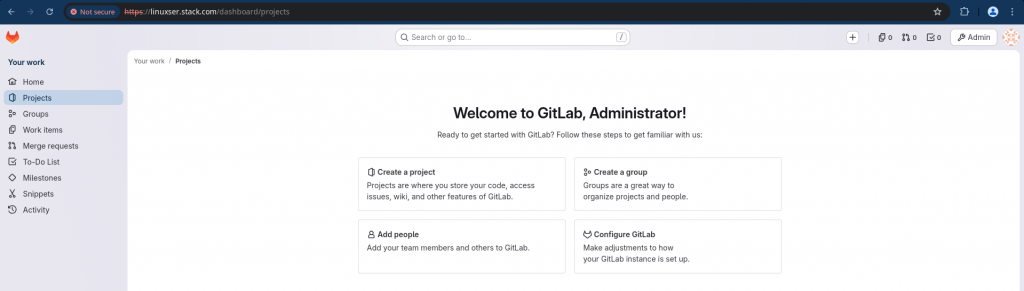
Let’s copy the ca certificate to the ca trust so that we can trust the self sign certifiate. Here Grafana is the client trying to connect with the Git Provider and validate its server certificate. So we need to copy the self sign certificate ca cert into the trust ca lodation for the connection to be successful.
admin@linuxser:~/gitlab-docker/ssl$ sudo cp ca.pem /etc/pki/ca-trust/source/anchors/
admin@linuxser:~/gitlab-docker/ssl$ sudo update-ca-trust
admin@linuxser:~/gitlab-docker/ssl$ sudo systemctl restart grafana-server
Step3: Ensure Provisioning enabled in Grafana
The provisioning feature toggle is enabled by default in Grafana Cloud and, starting in Grafana v13, for OSS and Enterprise as well. No manual configuration is required.
We can verify if the grafana instance is enabled with feature by using the below command.
admin@linuxser:~$ sudo journalctl -u grafana-server --no-pager | grep -E "provisioning|upserted"
Step3: Allow internal or private Git servers
By default Git Sync rejects repository URLs with a host that resolves to a loopback, a private (RFC 1918), link-local, or an unspecified address. This protects your Grafana instance against server-side request forgery (SSRF).
If you connect Git Sync to a Git server on a private network such as a self-hosted GitHub Enterprise, GitLab, or Bitbucket instance reachable only through an internal address, add its host to the allowed_git_urls allowlist.
As we have configured a self hosted gitlab instance which is running on a private network, let’s update the grafana configuration (ie. /etc/grafana/grafana.ini file) to allow the following gitlab provisioning url.
[provisioning]
allowed_git_urls = linuxser.stack.com:443
Step4: Create a Git Repository and Upload file
In this step we are going to login into Gitlab portal and create a sample repository to hold our grafana dashboard as code json files. Here are the details for the same.
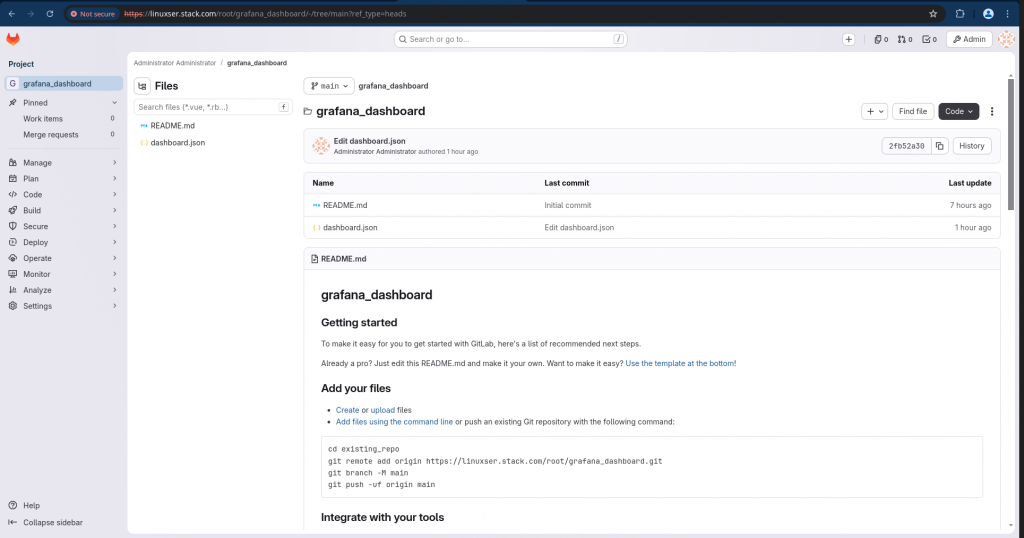
{
  "annotations": {},
  "editable": true,
  "fiscalYearStartMonth": 0,
  "graphTooltip": 0,
  "panels": [
    {
      "collapsed": false,
      "gridPos": {
        "h": 1,
        "w": 24,
        "x": 0,
        "y": 0
      },
      "id": 0,
      "panels": [],
      "title": "Overview",
      "type": "row"
    },
    {
      "fieldConfig": {
        "defaults": {
          "custom": {},
          "min": 0,
          "unit": "bps"
        },
        "overrides": []
      },
      "gridPos": {
        "h": 9,
        "w": 12,
        "x": 0,
        "y": 1
      },
      "options": {
        "legend": {
          "calcs": [],
          "displayMode": "list",
          "placement": "bottom",
          "showLegend": false
        },
        "tooltip": {
          "mode": "single",
          "sort": "asc"
        }
      },
      "repeatDirection": "h",
      "targets": [
        {
          "expr": "rate(node_network_transmit_bytes_total{device=\"enp1s0\"}[5m])",
          "legendFormat": "{{ device }}"
        }
      ],
      "title": "Network Bytes Transmitted",
      "transparent": false,
      "type": "timeseries"
    },
    {
      "fieldConfig": {
        "defaults": {
          "custom": {},
          "min": 0,
          "unit": "bps"
        },
        "overrides": []
      },
      "gridPos": {
        "h": 9,
        "w": 12,
        "x": 12,
        "y": 1
      },
      "options": {
        "legend": {
          "calcs": [],
          "displayMode": "list",
          "placement": "bottom",
          "showLegend": false
        },
        "tooltip": {
          "mode": "single",
          "sort": "asc"
        }
      },
      "repeatDirection": "h",
      "targets": [
        {
          "expr": "rate(node_network_receive_bytes_total{device=\"enp1s0\"}[5m])",
          "legendFormat": "{{ device }}"
        }
      ],
      "title": "Network Bytes received",
      "transparent": false,
      "type": "timeseries"
    },
    {
      "fieldConfig": {
        "defaults": {
          "max": 100,
          "min": 0,
          "unit": "percent"
        },
        "overrides": []
      },
      "gridPos": {
        "h": 9,
        "w": 12,
        "x": 0,
        "y": 10
      },
      "options": {
        "minVizHeight": 75,
        "minVizWidth": 75,
        "orientation": "auto",
        "reduceOptions": {
          "calcs": []
        },
        "showThresholdLabels": false,
        "showThresholdMarkers": true,
        "sizing": "auto"
      },
      "repeatDirection": "h",
      "targets": [
        {
          "expr": "100 - (avg by (instance) (irate(node_cpu_seconds_total{mode=\"idle\"}[5m])) * 100)",
          "legendFormat": "CPU Usage"
        }
      ],
      "title": "CPU Usage",
      "transparent": false,
      "type": "gauge"
    },
    {
      "fieldConfig": {
        "defaults": {
          "max": 100,
          "min": 0,
          "unit": "percent"
        },
        "overrides": []
      },
      "gridPos": {
        "h": 9,
        "w": 12,
        "x": 12,
        "y": 10
      },
      "options": {
        "minVizHeight": 75,
        "minVizWidth": 75,
        "orientation": "auto",
        "reduceOptions": {
          "calcs": []
        },
        "showThresholdLabels": false,
        "showThresholdMarkers": true,
        "sizing": "auto"
      },
      "repeatDirection": "h",
      "targets": [
        {
          "expr": "100 - ((node_memory_MemAvailable_bytes / node_memory_MemTotal_bytes) * 100)",
          "legendFormat": "Memory Usage"
        }
      ],
      "title": "Memory Usage",
      "transparent": false,
      "type": "gauge"
    }
  ],
  "refresh": "1m",
  "schemaVersion": 42,
  "tags": [
    "generated",
    "fedora-41"
  ],
  "templating": {},
  "time": {
    "from": "now-30m",
    "to": "now"
  },
  "timezone": "browser",
  "title": "Linuxser SDK generated monitoring dashboard",
  "uid": "linuxser-test-dashboard-2"
}
Step5: Configure Grafana Git Sync
Here we will try to setup Git Sync from Grafana portal. We will using the Pure Git type provider to connect with our internal GitLab server that we provisioned initially.
Navigate to Administration – General – Provisioning and select Pure Git to configure it.
- Paste the access token or password of the Git repository you want to sync in Access Token.
- Enter a Username. Git Sync will use this name to access the Git repository.
- Paste the Repository URL of your Git repository into the text box.
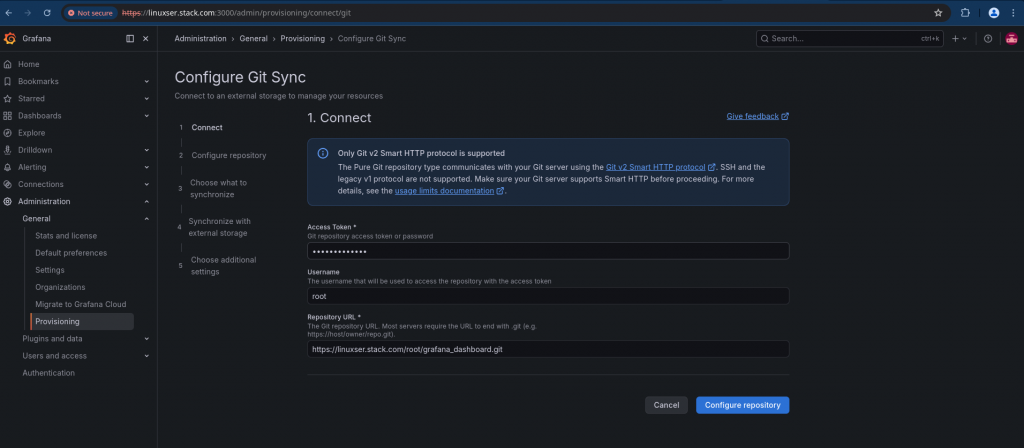
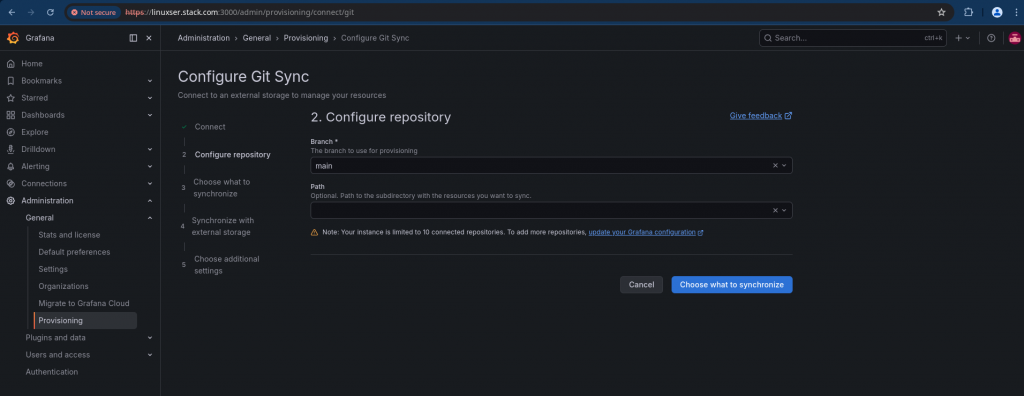
Here we will provide the details of the repository that we want to use for provisioning.
- Enter a Branch to use for provisioning. The default value is main.
- Optionally, you can add a Path to a subdirectory where your dashboards are stored.
Next we need to define how we want the external resources to be synched with grafana instance. We will go with the default setting “Sync external storage to a new Grafana folder”. This basically will create a top level folder within grafana dashboard and sync the resources from the repository to that top level folder without affecting anything else.
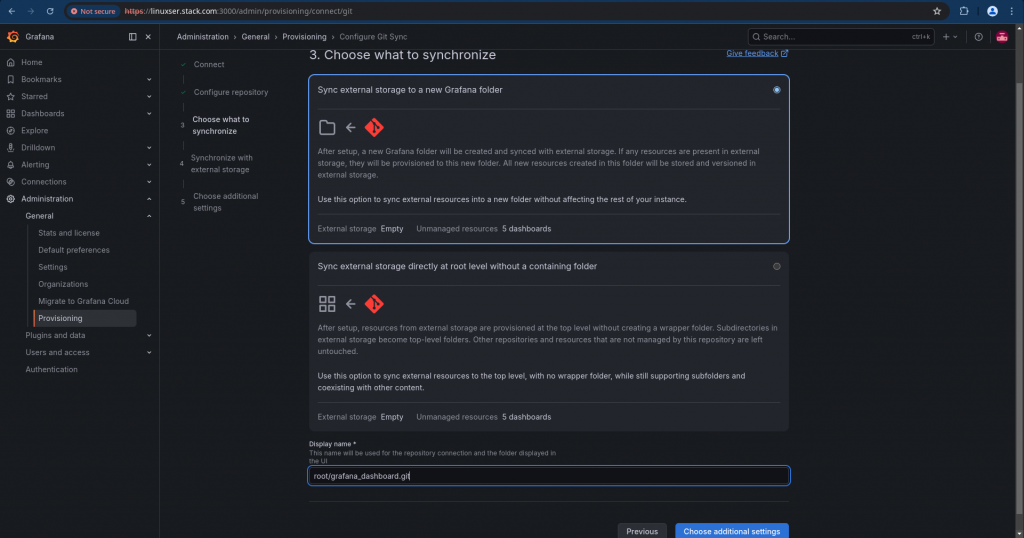
In the additional settings, we will go with the default settings.
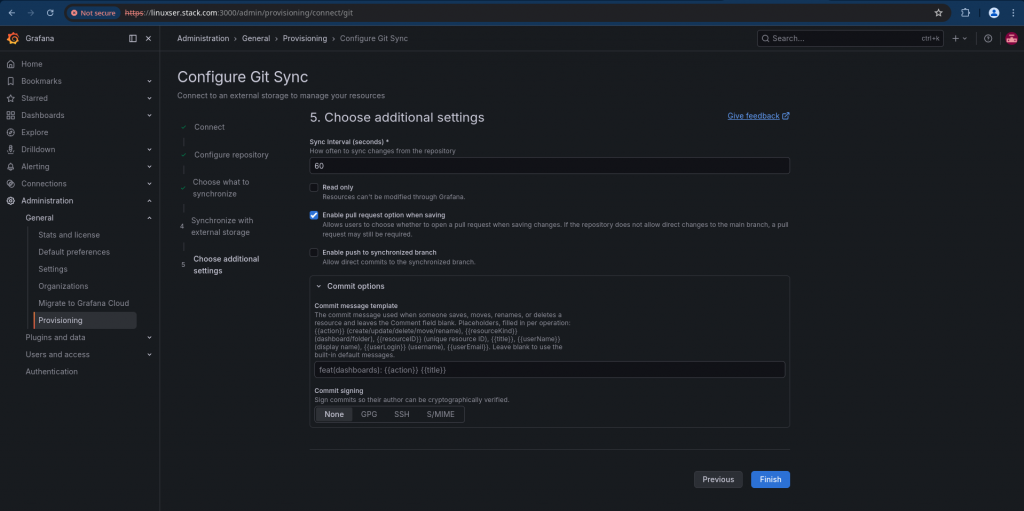
Once you finished with the configuration, you can validate the provisioning connection health status as shown below.
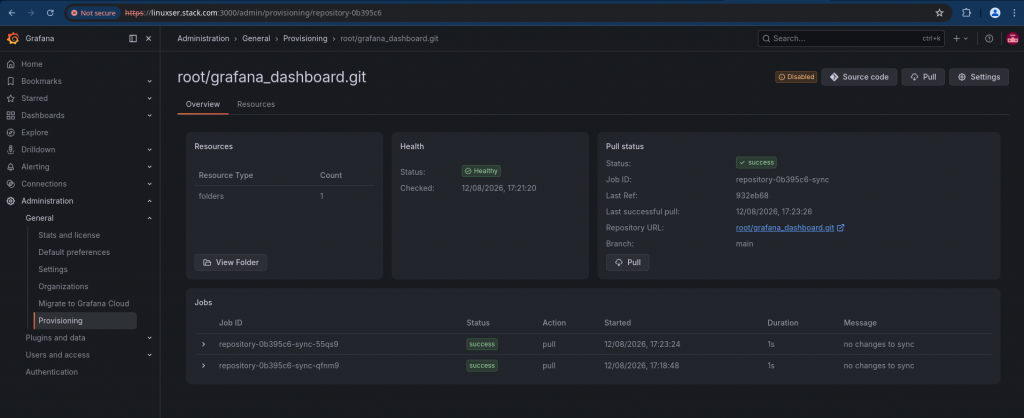
Step6: Validate Git Sync Status
Every 60 sec internal your git repository changes are synced with the Grafana as can be see in the jobs section below.
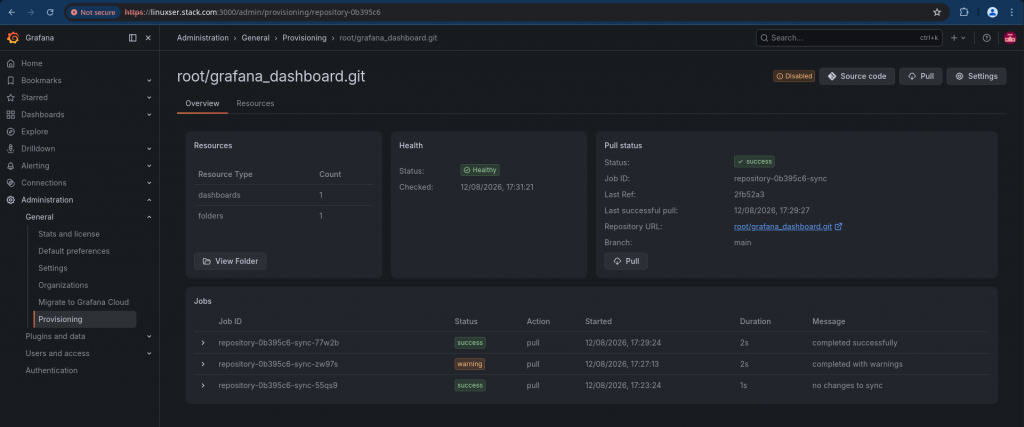
Step7: Validate Managed Dashboard
Now if you go to dashboards, you should be able to see the provisioned dashboard under a new top level folder with a display that we set in the configure Git Sync section.
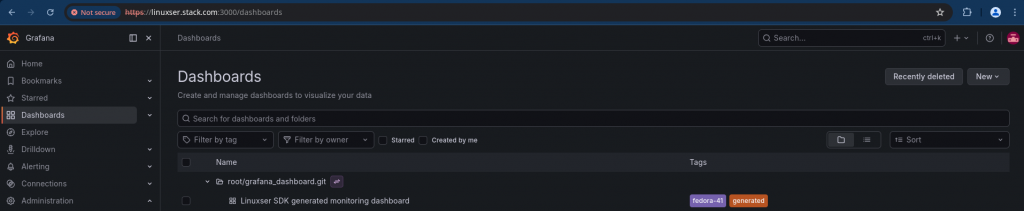
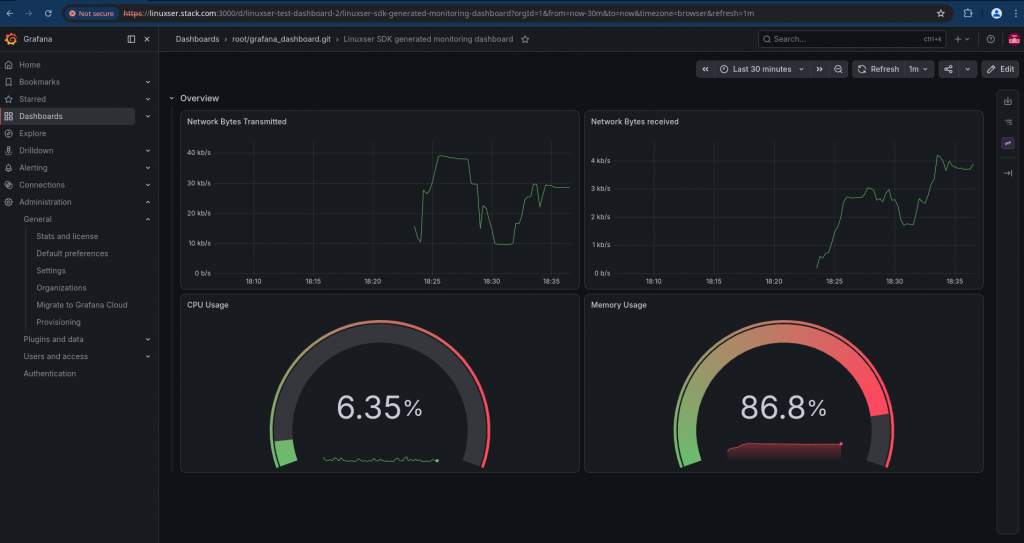
You can now get into the managed dashboard and see your metrics for the server as below.
Hope you enjoyed reading this article. Thank you..



Related Posts