How to instrument and visualize python application traces using Grafana

Here in this article we will instrument python application using Opentelemetry agent, collect and forward appliation traces using Grafana Alloy to Grafana Tempo for backend storage. We will further leverage Grafana to visualize these application traces using a dashboard.
Test Environment
- Fedora 41 server
- OTEL API and SDK
- Grafana-v13.1.1
- Grafana Alloy v1.20.0
- Grafana Tempo v3.0.3
What is Grafana Alloy
Grafana Alloy is an open source telemetry collector that simplifies how you gather and send observability data. Alloy collects metrics, logs, traces, and profiles in one unified solution. Instead of running separate collectors for each signal type, you configure a single tool that handles all your telemetry needs.
Also you learn one configuration language, manage one deployment, and use a single built-in UI for debugging. This unified approach reduces both complexity and resource consumption.
What is Grafana Tempo
Grafana Tempo is an open-source, high-scale distributed tracing backend designed to store and query trace data using cheap object storage instead of expensive indexing databases. Distributed tracing visualizes the lifecycle of a request as it passes through a set of applications.
Grafana ships with native support using the built-in Tempo data source.
What is OTEL API and SDK
In OpenTelemetry (OTel), the API and the SDK are two strictly separated components. The fundamental difference is that the API defines what telemetry data is gathered, while the SDK implements how that data is processed and shipped.
High Level Architecture

Image source: Set up for tracing
Procedure
Step1: Ensure Grafana repository enabled
As a first step let’s download and import and grafana gpg key and setup the grafana repository.
# Download and Import GPG key
admin@linuxser:~$ wget -q -O gpg.key https://rpm.grafana.com/gpg.key
admin@linuxser:~$ sudo rpm --import gpg.key

# Setup Grafana Repository
admin@linuxser:~$ echo -e '[grafana]\nname=grafana\nbaseurl=https://rpm.grafana.com\nrepo_gpgcheck=1\nenabled=1\ngpgcheck=1\ngpgkey=https://rpm.grafana.com/gpg.key\nsslverify=1\nsslcacert=/etc/pki/tls/certs/ca-bundle.crt' | sudo tee /etc/yum.repos.d/grafana.repo
[grafana]
name=grafana
baseurl=https://rpm.grafana.com
repo_gpgcheck=1
enabled=1
gpgcheck=1
gpgkey=https://rpm.grafana.com/gpg.key
sslverify=1
sslcacert=/etc/pki/tls/certs/ca-bundle.crt
Step2: Ensure Grafana service installed and running
Here we will install the grafana rpm package from the repository and start up the service with the default settings enabled.
# Install Grafana
admin@linuxser:~$ sudo dnf install grafana-server

# Start Grafana
admin@linuxser:~$ sudo systemctl start grafana-server.service
admin@linuxser:~$ sudo systemctl status grafana-server.service
Now let’s, validate the service using the below url.
URL: http://linuxser.stack.com:3000/
Step3: Ensure Grafana Tempo installed and running
Let’s now install Grafana Tempo rpm package and configure it to receive the application traces data from the Grafana Alloy as shown below.
admin@linuxser:~$ sudo dnf install tempo
admin@linuxser:~$ cat /etc/tempo/config.yml
stream_over_http_enabled: true
server:
  http_listen_port: 3200
  log_level: info

query_frontend:
  search:
    duration_slo: 5s
    throughput_bytes_slo: 1.073741824e+09
    metadata_slo:
        duration_slo: 5s
        throughput_bytes_slo: 1.073741824e+09
  trace_by_id:
    duration_slo: 5s

distributor:
  receivers:
    otlp:
      protocols:
        grpc:
          endpoint: "0.0.0.0:5317"
        http:
          endpoint: "0.0.0.0:5318"

storage:
  trace:
    backend: local                     # backend configuration to use
    wal:
      path: /var/tempo/wal             # where to store the wal locally
    local:
      path: /var/tempo/blocks
Let’s now start up the Grafana tempo service as shown below.
admin@linuxser:~$ sudo systemctl start tempo.service
admin@linuxser:~$ sudo systemctl status tempo.service
admin@linuxser:~$ sudo systemctl start tempo.service
admin@linuxser:~$ sudo systemctl status tempo.service
Step4: Ensure Grafana Alloy installed and running
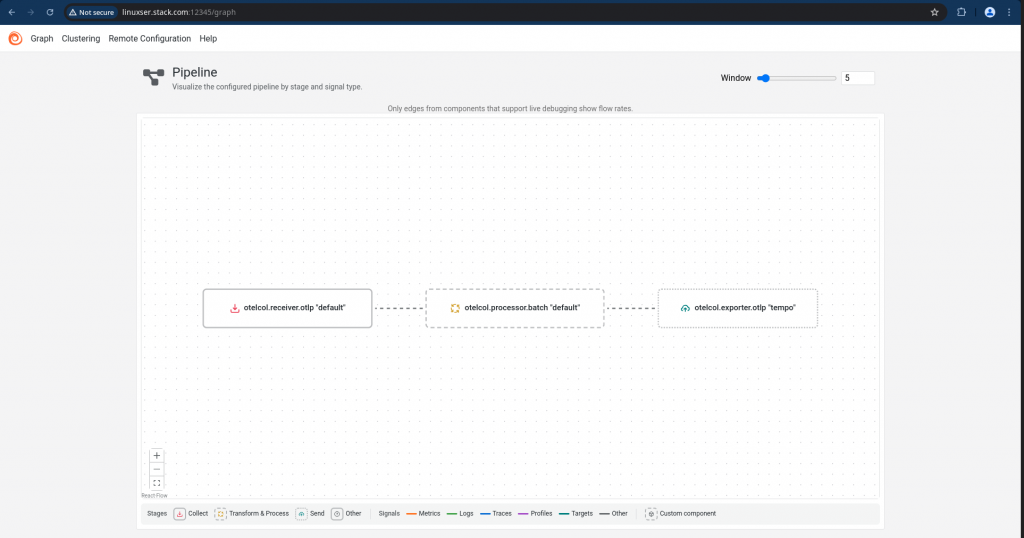
Let’s now install Grafana Alloy package and update its configuration such that it collects the application traces sent on OTel gRPC and HTTP endpoint and forward them to Grafana Tempo gRPC or HTTP listner endpoints as shown below.
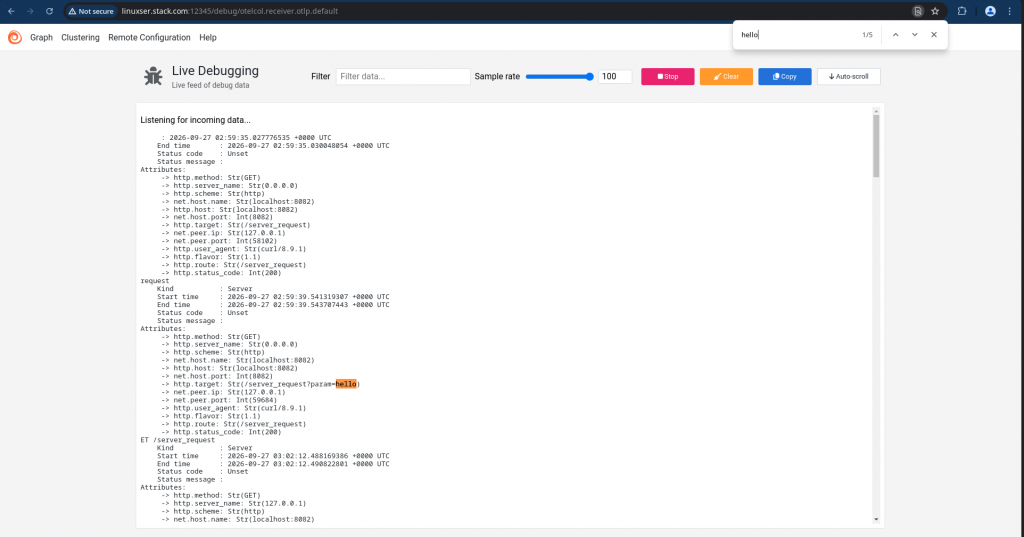
We are also enabling the livedebugging feature with the alloy configuration so that we can capture the trace data that is collected and forwarded through the grafana alloy.
admin@linuxser:~$ sudo dnf install alloy
admin@linuxser:~$ cat /etc/alloy/config.alloy
// Receive OTLP data (gRPC on port 4317, HTTP on port 4318) from the Python app
otelcol.receiver.otlp "default" {
  grpc {
    endpoint = "0.0.0.0:4317"
  }
  http {
    endpoint = "0.0.0.0:4318"
  }

  output {
    traces = [otelcol.processor.batch.default.input]
  }
}

// Batch data to optimize performance and reduce network calls
otelcol.processor.batch "default" {
  send_batch_size     = 5
  send_batch_max_size = 10
  timeout             = "2s"

  output {
    traces = [otelcol.exporter.otlp.tempo.input]
  }
}


// Debug exporter to see all traces
// otelcol.exporter.logging "default" {
//  loglevel = "debug"
// }

// Export traces to Tempo instance over gRPC
otelcol.exporter.otlp "tempo" {
  client {
    endpoint = "127.0.0.1:5317"
    tls {
      insecure = true
    }
  }
}

// Export traces to Tempo instance over HTTP
//otelcol.exporter.otlphttp "tempohttp" {
//  client {
//    endpoint = "http://127.0.0.1:5318"
//    tls {
//      insecure = true
//    }
//  }
//}


livedebugging {
  enabled = true
}
In order to visualize the data pipeline we need to enable the following HTTP listner port as shown below.
admin@linuxser:~$ sudo cat /etc/sysconfig/alloy | grep -i custom_args
CUSTOM_ARGS="--server.http.listen-addr=0.0.0.0:12345"
Now let’s start up the grafana alloy service and verify its status.
admin@linuxser:~$ sudo systemctl start alloy.service
admin@linuxser:~$ sudo systemctl status alloy.service
URL: http://linuxser.stack.com:12345/graph
Step5: Instrument Python Application
In this step we are going to install the OpenTelemetry Python SDK and API libraries.
- opentelemetry-distro: Installs the core OpenTelemetry Python distribution (ie. opentelemetry-instrument and opentelemetry-bootstrap).
- opentelemetry-exporter-otlp-proto-grpc: Its used to send telemetry signals using OTLP over gRPC.
- opentelemetry-exporter-otlp-proto-http: Its used to send telemetry signals using OTLP over HTTP.
- opentelemetry-bootstrap: Scans virtual environment for installed libraries and installs the matching OpenTelemetry instrumentation packages.
- opentelemetry-instrument: Traces will be generated automatically for incoming Flask requests and outgoing requests HTTP calls without manually adding tracing code everywhere.
admin@linuxser:~$ mkdir auto_instrumentation
admin@linuxser:~$ cd auto_instrumentation
admin@linuxser:~/auto_instrumentation$ python -m venv venv
admin@linuxser:~/auto_instrumentation$ source ./venv/bin/activate

(venv) admin@linuxser:~/auto_instrumentation$ pip install opentelemetry-distro
(venv) admin@linuxser:~/auto_instrumentation$ pip install opentelemetry-exporter-otlp-proto-grpc
(venv) admin@linuxser:~/auto_instrumentation$ pip install opentelemetry-exporter-otlp-proto-http
(venv) admin@linuxser:~/auto_instrumentation$ pip install flask requests
(venv) admin@linuxser:~/auto_instrumentation$ opentelemetry-bootstrap -a install
Here is the sample python flask web application that we will instrurmenting using zero code changes.
admin@linuxser:~/auto_instrumentation$ cat server_automatic.py
# Copyright The OpenTelemetry Authors
# SPDX-License-Identifier: Apache-2.0

from flask import Flask, request

app = Flask(__name__)


@app.route("/server_request")
def server_request():
    print(request.args.get("param"))
    return "served"


if __name__ == "__main__":
    app.run(port=8082)
Step6: Run Application
Here we are going to run python application using the auto instrumention using the “opentelemetry-instrument” binary. We will exposing the trace data over “grpc” protocol
Running with OTLP over gRPC (High Performance)
export OTEL_SERVICE_NAME="python-grpc-service"
export OTEL_EXPORTER_OTLP_ENDPOINT="http://localhost:4317"
export OTEL_EXPORTER_OTLP_PROTOCOL="grpc"

opentelemetry-instrument python server_automatic.py
You can as well run the python application using the auto instrumentation with trace data exposed over “http” protocol using the below.
Running with OTLP over HTTP (High Compatibility)
export OTEL_SERVICE_NAME="python-http-service"
export OTEL_EXPORTER_OTLP_ENDPOINT="http://localhost:4318"
export OTEL_EXPORTER_OTLP_PROTOCOL="http/protobuf"

opentelemetry-instrument python server_automatic.py
NOTE: If HTTP protocol is used to expose the traces, you need to update the Alloy configuration to send trace data to HTTP listener endpoint of Tempo. Here is the snippet to update and restart the service. Also please make to update the input reference within the receivers output.
// Export traces to Tempo instance over HTTP
otelcol.exporter.otlphttp "tempohttp" {
  client {
    endpoint = "http://127.0.0.1:5318"
    tls {
      insecure = true
    }
  }
}
Now let’s generate some traffic by hitting the following flask endpoints.
admin@linuxser:~$ curl http://localhost:8082/server_request?param=hello
servedadmin@linuxser:~$ curl http://localhost:8082/server_request?param=hello
servedadmin@linuxser:~$ curl http://localhost:8082/server_request?param=hello
servedadmin@linuxser:~$ curl http://localhost:8082/server_request?param=hello
servedadmin@linuxser:~$ curl http://localhost:8082/server_request?param=hello
servedadmin@linuxser:~$ curl http://localhost:8082/server_request
servedadmin@linuxser:~$ curl http://localhost:8082/server_request
servedadmin@linuxser:~$ curl http://localhost:8082/server_request
servedadmin@linuxser:~$ curl http://localhost:8082/server_request
servedadmin@linuxser:~$ curl http://localhost:8082/server_request
You can validate the console logs where the flask application is running for the reponse logs.
hello
127.0.0.1 - - [27/Sep/2026 04:51:57] "GET /server_request?param=hello HTTP/1.1" 200 -
hello
127.0.0.1 - - [27/Sep/2026 04:51:58] "GET /server_request?param=hello HTTP/1.1" 200 -
hello
127.0.0.1 - - [27/Sep/2026 04:51:58] "GET /server_request?param=hello HTTP/1.1" 200 -
hello
127.0.0.1 - - [27/Sep/2026 04:51:59] "GET /server_request?param=hello HTTP/1.1" 200 -
hello
127.0.0.1 - - [27/Sep/2026 04:51:59] "GET /server_request?param=hello HTTP/1.1" 200 -
None
127.0.0.1 - - [27/Sep/2026 04:52:03] "GET /server_request HTTP/1.1" 200 -
None
127.0.0.1 - - [27/Sep/2026 04:52:04] "GET /server_request HTTP/1.1" 200 -
None
127.0.0.1 - - [27/Sep/2026 04:52:04] "GET /server_request HTTP/1.1" 200 -
None
127.0.0.1 - - [27/Sep/2026 04:52:05] "GET /server_request HTTP/1.1" 200 -
None
127.0.0.1 - - [27/Sep/2026 04:52:05] "GET /server_request HTTP/1.1" 200 -
Also we can check the livedebugging console for “otelcol.receiver.otlp.default” to validate the trace data that is received by the Alloy component.
Step7: Configure Grafana Tempo datasource
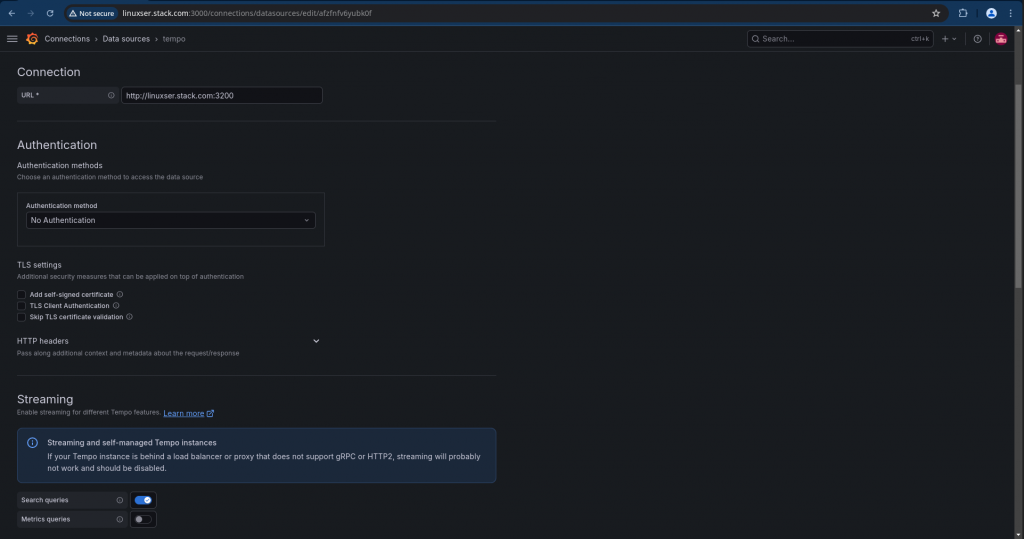
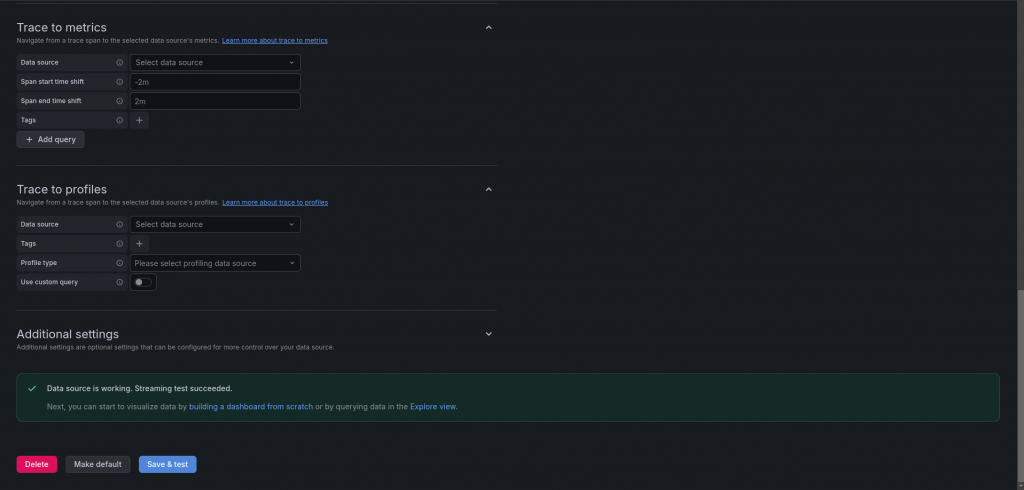
Now its time to configure Grafana Tempo datasource within the Grafana portal as shown below and validate the connection.
Step8: Visualize Python Application Traces
Naviage to Grafana Dashboard – EXplore and select Tempo as the datasource. Search for service name “python-grpc-service” and you should be able to see the traces for the python application as shown below.
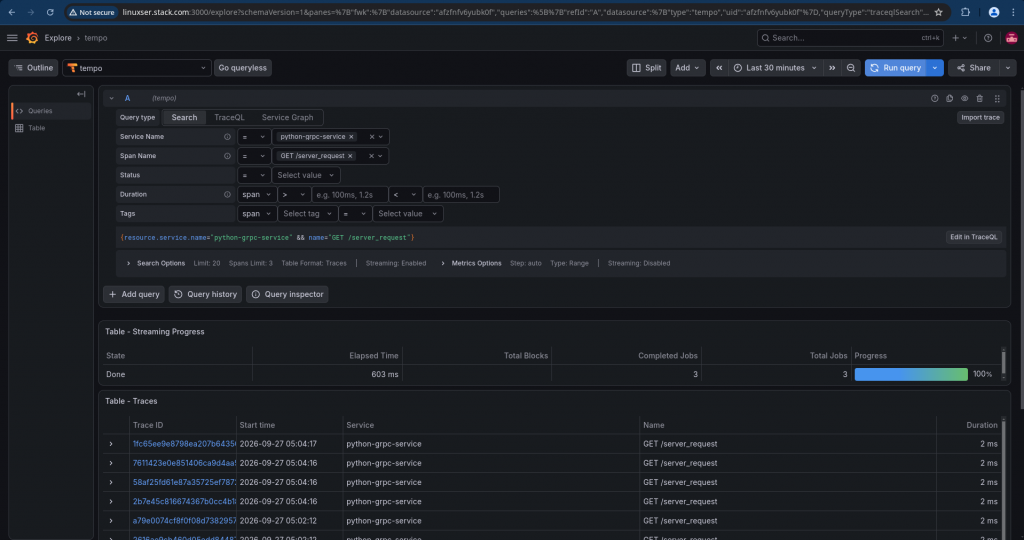
You can now further dig deeper into the traceid’s and get the details the request attributes and response times.
Hope you enjoyed reading this article. Thank you..



Related Posts