Observability as Code using Grafana Foundation SDK
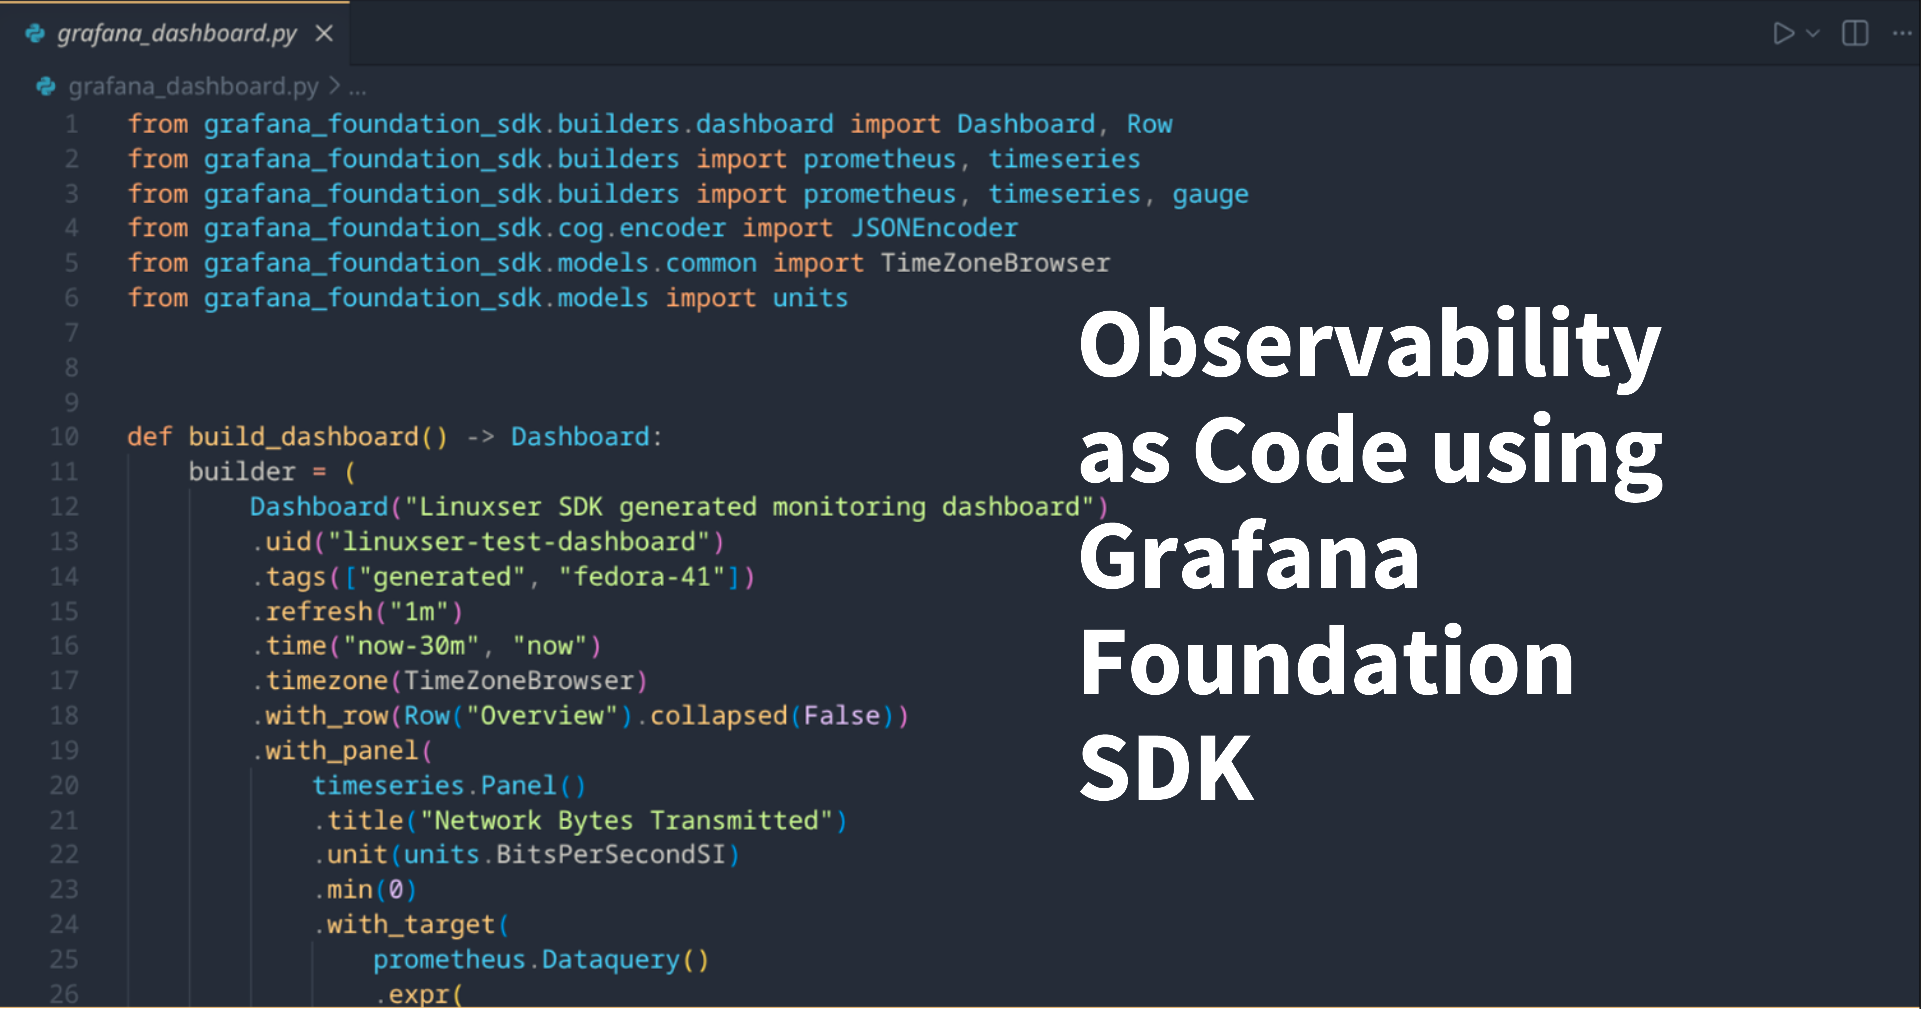
Here in this article we will try to leverage Grafana Foundation SDK designed for Observability as Code to generate Dashboards, Panels and Queries.
Test Environment
- Fedora 41 server
- Grafana v13.1.1
- Prometheus v3.13.1
- Prometheus Node Exporter v1.12.1
Grafana Foundation SDK
Grafana Foundation SDK is a set of tools, types, and libraries that let you define Grafana dashboards and resources using strongly typed code.
- Strongly typed code: Allows us to Catch errors at compile time, ensuring more reliable configurations.
- Version Control: Track observability as code changes using version control system allows for maintainability and auditability.
- CICD Integration: Integrate within the CICD workflow for automated provisioning of dashboard which provides consistent and repeatable setups.
The SDK supports multiple programming languages, including Go, TypeScript, Python, PHP, and Java, so you can choose the one that best fits your development environment.
Procedure
Step1: Ensure Grafana Installed and Running
As a first step ensure that you have a running instance of grafana on your local machine. You can follow “How to Setup Grafana on Fedora OS” for the same.
Step2: Install Grafana Foundation SDK for Python
Let’s first install the python pip package for Grafana Foundation SDK.
admin@linuxser:~$ python3 -m pip install 'grafana_foundation_sdk==v0.0.18'
Defaulting to user installation because normal site-packages is not writeable
...
Installing collected packages: grafana_foundation_sdk
Successfully installed grafana_foundation_sdk-0.0.18
Step3: Define Dashboard using code
Grafana Foundation SDK is based on composable builder pattern. We can use these builder blocks to build each component within the dashboard and chain them together.
Almost every piece of the dashboard, including dashboards, panels, rows, queries, and variables, has its own Builder class.
First we create a dashboard builder block within which we define the dashboard attributes such as title, tags, refresh interval, timerange and timezone to use.
Within the dashboard builder block we add a collapsible row and multiple panels. Each panel builder block is defined within the with_panel() code block which is chained within the main dashboard builder block.
As you can infer from the code, that we added four panel builder block with the below titles.
- Network Bytes Transmitted
- Network Bytes received
- CPU Usage
- Memory Usage
Each panel builder defines its own attributes like title and unit of measurments being visualized. Also within each panel component we have a third builder block (ie. prometheus) which is our target datasource from which the metrics are being queried.
Finally once we build this dashboard, we are encoding it using the JSON encoder and printed on the screen.
admin@fedser:grafana_foundation_sdk_demo$ cat grafana_dashboard.py
from grafana_foundation_sdk.builders.dashboard import Dashboard, Row
from grafana_foundation_sdk.builders import prometheus, timeseries
from grafana_foundation_sdk.builders import prometheus, timeseries, gauge
from grafana_foundation_sdk.cog.encoder import JSONEncoder
from grafana_foundation_sdk.models.common import TimeZoneBrowser
from grafana_foundation_sdk.models import units


def build_dashboard() -> Dashboard:
    builder = (
        Dashboard("Linuxser SDK generated monitoring dashboard")
        .uid("linuxser-test-dashboard")
        .tags(["generated", "fedora-41"])
        .refresh("1m")
        .time("now-30m", "now")
        .timezone(TimeZoneBrowser)
        .with_row(Row("Overview").collapsed(False))
        .with_panel(
            timeseries.Panel()
            .title("Network Bytes Transmitted")
            .unit(units.BitsPerSecondSI)
            .min(0)
            .with_target(
                prometheus.Dataquery()
                .expr(
                    'rate(node_network_transmit_bytes_total{device="enp1s0"}[5m])'
                )
                .legend_format("{{ device }}")
            )
        )

        .with_panel(
            timeseries.Panel()
            .title("Network Bytes received")
            .unit(units.BitsPerSecondSI)
            .min(0)
            .with_target(
                prometheus.Dataquery()
                .expr(
                    'rate(node_network_receive_bytes_total{device="enp1s0"}[5m])'
                )
                .legend_format("{{ device }}")
            )
        )

        .with_panel(
            gauge.Panel()
            .title("CPU Usage")
            .unit(units.Percent)
            .min(0)
            .max(100)
            .with_target(
                prometheus.Dataquery()
                .expr(
                    '100 - (avg by (instance) (irate(node_cpu_seconds_total{mode="idle"}[5m])) * 100)'
                )
                .legend_format("CPU Usage")
            )
        )

        .with_panel(
            gauge.Panel()
            .title("Memory Usage")
            .unit(units.Percent)
            .min(0)
            .max(100)
            .with_target(
                prometheus.Dataquery()
                .expr(
                    '100 - ((node_memory_MemAvailable_bytes / node_memory_MemTotal_bytes) * 100)'
                )
                .legend_format("Memory Usage")
            )
        )
    )

    return builder


if __name__ == "__main__":
    dashboard = build_dashboard().build()
    encoder = JSONEncoder(sort_keys=True, indent=2)

    print(encoder.encode(dashboard))
Step4: Build Dashboard
Let’s now try to execute our python script to generate the dashboard as code in json format and write it into a file.
admin@linuxser:~/grafana_sdk$ python grafana_dashboard.py > dashboard.json
admin@linuxser:grafana_sdk$ cat dashboard.json
{
  "annotations": {},
  "editable": true,
  "fiscalYearStartMonth": 0,
  "graphTooltip": 0,
  "panels": [
    {
      "collapsed": false,
      "gridPos": {
        "h": 1,
        "w": 24,
        "x": 0,
        "y": 0
      },
      "id": 0,
      "panels": [],
      "title": "Overview",
      "type": "row"
    },
    {
      "fieldConfig": {
        "defaults": {
          "custom": {},
          "min": 0,
          "unit": "bps"
        },
        "overrides": []
      },
      "gridPos": {
        "h": 9,
        "w": 12,
        "x": 0,
        "y": 1
      },
      "options": {
        "legend": {
          "calcs": [],
          "displayMode": "list",
          "placement": "bottom",
          "showLegend": false
        },
        "tooltip": {
          "mode": "single",
          "sort": "asc"
        }
      },
      "repeatDirection": "h",
      "targets": [
        {
          "expr": "rate(node_network_transmit_bytes_total{device=\"enp1s0\"}[5m])",
          "legendFormat": "{{ device }}"
        }
      ],
      "title": "Network Bytes Transmitted",
      "transparent": false,
      "type": "timeseries"
    },
    {
      "fieldConfig": {
        "defaults": {
          "custom": {},
          "min": 0,
          "unit": "bps"
        },
        "overrides": []
      },
      "gridPos": {
        "h": 9,
        "w": 12,
        "x": 12,
        "y": 1
      },
      "options": {
        "legend": {
          "calcs": [],
          "displayMode": "list",
          "placement": "bottom",
          "showLegend": false
        },
        "tooltip": {
          "mode": "single",
          "sort": "asc"
        }
      },
      "repeatDirection": "h",
      "targets": [
        {
          "expr": "rate(node_network_receive_bytes_total{device=\"enp1s0\"}[5m])",
          "legendFormat": "{{ device }}"
        }
      ],
      "title": "Network Bytes received",
      "transparent": false,
      "type": "timeseries"
    },
    {
      "fieldConfig": {
        "defaults": {
          "max": 100,
          "min": 0,
          "unit": "percent"
        },
        "overrides": []
      },
      "gridPos": {
        "h": 9,
        "w": 12,
        "x": 0,
        "y": 10
      },
      "options": {
        "minVizHeight": 75,
        "minVizWidth": 75,
        "orientation": "auto",
        "reduceOptions": {
          "calcs": []
        },
        "showThresholdLabels": false,
        "showThresholdMarkers": true,
        "sizing": "auto"
      },
      "repeatDirection": "h",
      "targets": [
        {
          "expr": "100 - (avg by (instance) (irate(node_cpu_seconds_total{mode=\"idle\"}[5m])) * 100)",
          "legendFormat": "CPU Usage"
        }
      ],
      "title": "CPU Usage",
      "transparent": false,
      "type": "gauge"
    },
    {
      "fieldConfig": {
        "defaults": {
          "max": 100,
          "min": 0,
          "unit": "percent"
        },
        "overrides": []
      },
      "gridPos": {
        "h": 9,
        "w": 12,
        "x": 12,
        "y": 10
      },
      "options": {
        "minVizHeight": 75,
        "minVizWidth": 75,
        "orientation": "auto",
        "reduceOptions": {
          "calcs": []
        },
        "showThresholdLabels": false,
        "showThresholdMarkers": true,
        "sizing": "auto"
      },
      "repeatDirection": "h",
      "targets": [
        {
          "expr": "100 - ((node_memory_MemAvailable_bytes / node_memory_MemTotal_bytes) * 100)",
          "legendFormat": "Memory Usage"
        }
      ],
      "title": "Memory Usage",
      "transparent": false,
      "type": "gauge"
    }
  ],
  "refresh": "1m",
  "schemaVersion": 42,
  "tags": [
    "generated",
    "fedora-41"
  ],
  "templating": {},
  "time": {
    "from": "now-30m",
    "to": "now"
  },
  "timezone": "browser",
  "title": "Linuxser SDK generated monitoring dashboard",
  "uid": "linuxser-test-dashboard"
}
Step5: Import Dashboard
Its time to now import our dashboard as code json file into grafana. Navigate to Grafana portal to import your new dashboard in JSON format.
- Dashboards – Import Dashboard
- Upload the dashboard JSON file or copy the JSON data
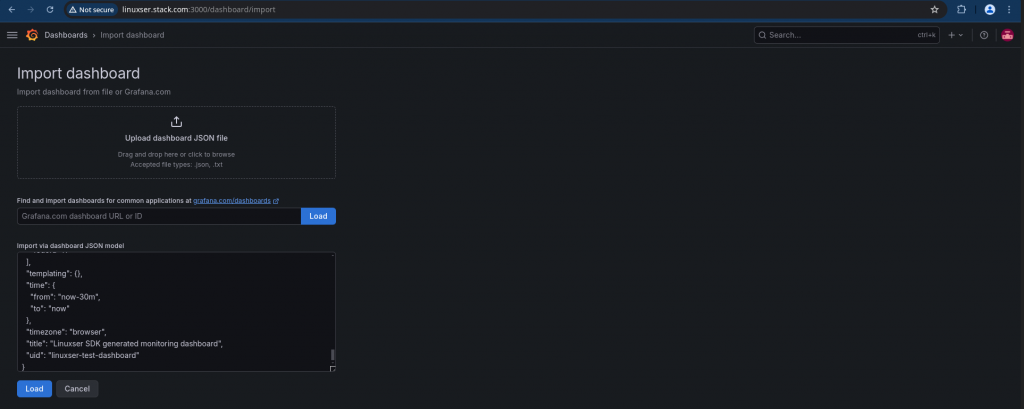
Now you can validate your grafana foundation sdk generated dashboard as shown below.
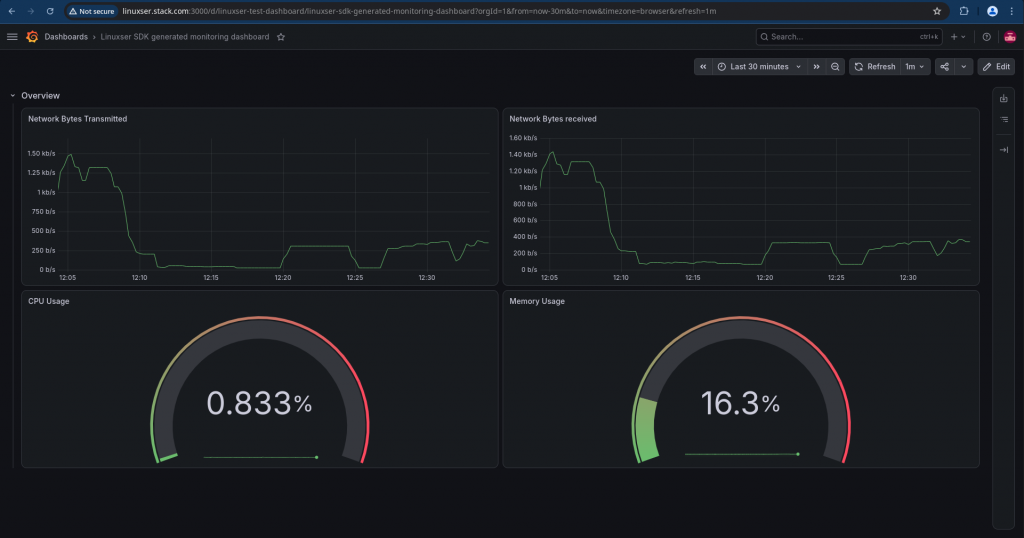
So here we just went through the most basics of using the grafana foundation sdk to code grafana resources such as dashboards. But there is a lot more by leveraging this SDK.
Hope you enjoyed reading this article. Thank you..



Related Posts