Leveraging gcx CLI tool to manage Grafana OSS

Here in this article we will try to leverage Grafana CLI tool (ie. gcx) to manage Grafana OSS resources.
Test Environment
- Fedora 41 server
- Grafana v13.1.1
- Prometheus v3.13.1
- Prometheus Node Exporter v1.12.1
Grafana gcx CLI tool
Grafana gcx is a CLI for managing Grafana and Grafana Cloud resources in Cloud, Enterprise or OSS platforms. It is optimized for agentic usage. We can use this tool authenticate, manage multiple environments, and perform administrative tasks all from the terminal.
gcx is a single CLI that ships with a suite of agent skills and allows you and your AI coding agent structured access to both Grafana (dashboards, folders, alert rules, data sources) and many more.
It works with any agentic coding tool. It ships with a suite of agent skills for common workflows like alert investigation, dashboard creation and GitOps, SLO management, and observability setup – ready to use out of the box.
If you are interested in watching the video. Here is the YouTube video on the same step by step procedure outlined below.
Procedure
Step1: Ensure Grafana Running
As a first step ensure that you have Grafana installed and running. Also make sure to get some metrics captured through a datasource configuration and visualize it through a dashboard.
Follow “Raw Metrics to Rich Insights using Prometheus and Grafana” for a sample setup with Prometheus and Grafana for the same.
Step2: Install gcx cli
Here we are going to download and install the gcx client tool for linux x86_64 arch platform. By default the binary will be installed locally for the user.
admin@linuxser:~$ sudo curl -fsSL https://raw.githubusercontent.com/grafana/gcx/main/scripts/install.sh | sh
  Fetching latest release...
  Installing gcx 1.0.0 (linux/amd64)
  Downloading gcx_1.0.0_linux_amd64.tar.gz...
  Checksum verified.
  Installed: gcx version 1.0.0 built from 45e64ca41565601621e400f8a1f65687d12e6673 on 2026-07-28T12:01:50Z

  To uninstall: rm /home/admin/.local/bin/gcx
Step3: Create a Grafana Service Account
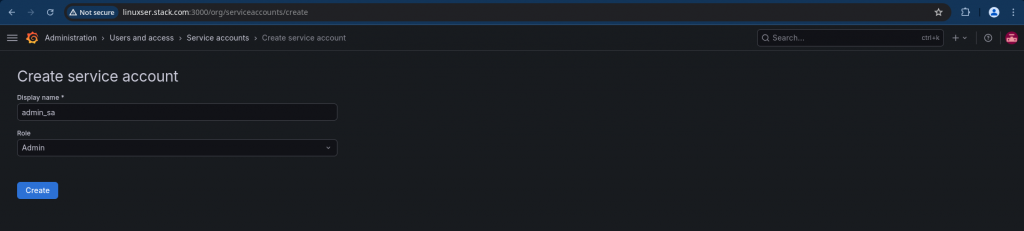
Let’s now create a service account and associated token with the administrative privileges as shown below.
Create a Service Account
Add Service Account Token
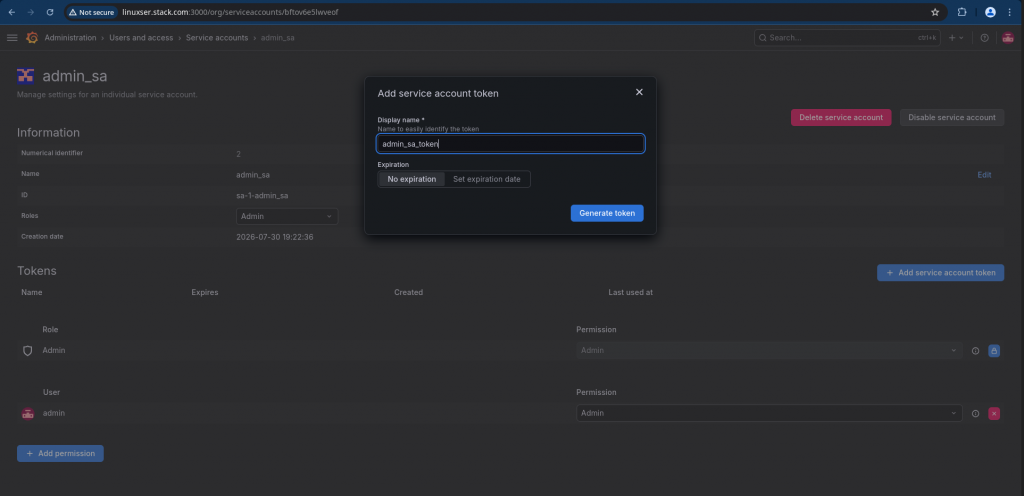
Ensure that you copy and save the generated token for future reference.
admin_sa_token: glsa_xxxx_09181328
Step4: Authenticate with Grafana using CLI
It’s time to now configure our gcx client by logging into the grafana server that you have running with the sevice account token that we just generated.
admin@linuxser:~$ gcx login --yes --server http://linuxser.stack.com:3000 --token glsa_EF1hDfbcoQz7Z0BXfryvKcq3ESCQ7bot_09181328
Creating new context "linuxser-stack-com"
Existing contexts: default

Logged in to http://linuxser.stack.com:3000
  Context:     linuxser-stack-com
  Auth method: token
  Version:     13.1.1
  Grafana Cloud: no

Verify access anytime with: gcx config check
Now let’s verify our config as shown below. Check for the context “linuxser-stack-com” ensure that its looking correct.
admin@linuxser:~$ gcx config check
✔ Configuration file: /home/admin/.config/gcx/config.yaml
✔ Current context: linuxser-stack-com

Context: default
================
✘ Configuration: Invalid configuration: context references no stack with grafana config
⚠ Connectivity: skipped
⚠ Grafana version: skipped

🛈 Suggestions:

  • Review your configuration: gcx config view
  • Run `gcx login` to configure a stack for this context

Context: linuxser-stack-com
===========================
✔ Configuration: valid
🛈 Auth method: token
🛈 Context type: On-prem
✔ Connectivity: online
✔ Grafana version: 13.1.1
Step5: Validate Grafana Resources using gcx
Now its time to interact with our grafana resources using the gcx client. Here are some the commands that we can run to communicated with the grafana service.
List Datasources
admin@linuxser:~$ gcx datasources list
┌───────────────────┬───────────────────┬──────────────────┬────────────────────────────────┬──────────────────┐
│ UID               │ NAME              │ TYPE             │ URL                            │ DEFAULT          │
├───────────────────┼───────────────────┼──────────────────┼────────────────────────────────┼──────────────────┤
│ dftg73mih8agwc    │ prometheus        │ prometheus       │ http://linuxser.stack.com:9090 │ *                │
└───────────────────┴───────────────────┴──────────────────┴────────────────────────────────┴──────────────────┘
List Dashboards
admin@linuxser:~$ gcx dashboards list
┌─────────────────┬──────────────────────────────────────┬─────────────────┬─────────────────┬─────────────────┐
│ NAME            │ TITLE                                │ FOLDER          │ TAGS            │ AGE             │
├─────────────────┼──────────────────────────────────────┼─────────────────┼─────────────────┼─────────────────┤
│ adj5qq7         │ linuxser monitoirng dashboard        │ General         │                 │ 2d              │
│ adrhnj6         │ Grafana Default Datasource Dashboard │ General         │                 │ 4d              │
└─────────────────┴──────────────────────────────────────┴─────────────────┴─────────────────┴─────────────────┘
CPU Usage
admin@linuxser:~$ gcx metrics query '100 - (avg by (instance) (rate(node_cpu_seconds_total{mode="idle"}[5m])) * 100)' --since 1h
┌────────────────────────────────────┬────────────────────────────────────┬────────────────────────────────────┐
│ VALUE                              │ TIMESTAMP                          │ SERIES                             │
├────────────────────────────────────┼────────────────────────────────────┼────────────────────────────────────┤
│ 75.24555352777764                  │ 2026-07-30T17:42:00Z               │ {instance="localhost:9100"}        │
│ 55.48854306944436                  │ 2026-07-30T17:43:00Z               │ {instance="localhost:9100"}        │
│ 35.689931546296265                 │ 2026-07-30T17:44:00Z               │ {instance="localhost:9100"}        │
│ 15.96441537673607                  │ 2026-07-30T17:45:00Z               │ {instance="localhost:9100"}        │
│ 1.2960526315789735                 │ 2026-07-30T17:46:00Z               │ {instance="localhost:9100"}        │
│ 1.1885964912281395                 │ 2026-07-30T17:47:00Z               │ {instance="localhost:9100"}        │
└────────────────────────────────────┴────────────────────────────────────┴────────────────────────────────────┘
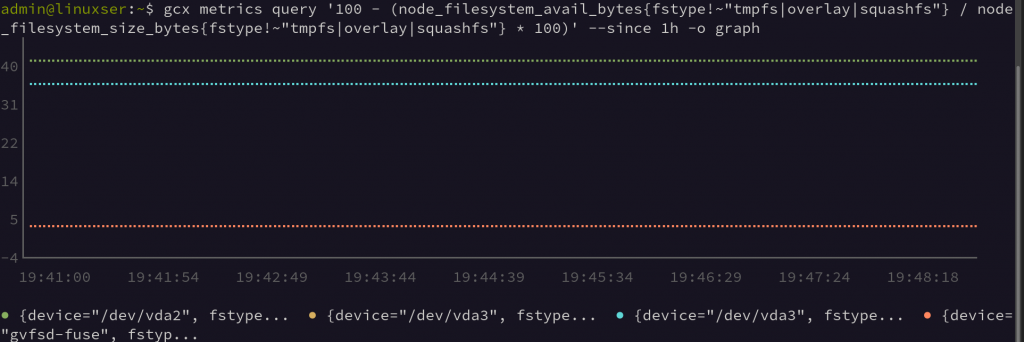
Disk Usage
admin@linuxser:~$ gcx metrics query '100 - (node_filesystem_avail_bytes{fstype!~"tmpfs|overlay|squashfs"} / node_filesystem_size_bytes{fstype!~"tmpfs|overlay|squashfs"} * 100)' --since 1h -o graph
Hope you enjoyed reading this article. Thank you..



Related Posts