How to Setup Grafana on Fedora OS

Here in this article we will try to setup Grafana service on Fedora OS by installing it using the RPM package.
Test Environment
- Fedora 41 server
- Grafana v13.1.1
What is Grafana
Grafana Open source software also know as Grafana OSS is a multi-platform open source analytics and interactive visualization web application. It provides charts, graphs, and alerts for the web when connected to supported data sources. It enables us to query, visualize, alert and explore the metrics, logs and traces from different sources.
Grafana OSS provides us with different tools and plugin framework for integration with different external datasources. Also it provides us with tools to turn the time-series database (TSDB) data into insightful graphs and visualizations.
Procedure
Step1: Install GPG Key
As a first step we need to import the public GPG signing key into system’s RPM database to allow for package verification.
admin@linuxser:~$ wget -q -O gpg.key https://rpm.grafana.com/gpg.key
admin@linuxser:~$ sudo rpm --import gpg.key
Step2: Create grafana yum repository
Here we are going to configure the grafana repository file from where we will be able to download the RPM package.
admin@linuxser:~$ sudo tee /etc/yum.repos.d/grafana.repo << EOF
[grafana]
name=grafana
baseurl=https://rpm.grafana.com
repo_gpgcheck=1
enabled=1
gpgcheck=1
gpgkey=https://rpm.grafana.com/gpg.key
sslverify=1
EOF
Step3: Install Grafana
Now let’s install the grafana RPM package using the dnf tool as shown below.
admin@linuxser:~$ sudo dnf install grafana
...
>>> Scriptlet output:
>>> ### NOT starting on installation, please execute the following statements to configure grafana to start auto
>>>  sudo /bin/systemctl daemon-reload
>>>  sudo /bin/systemctl enable grafana-server.service
>>> ### You can start grafana-server by executing
>>>  sudo /bin/systemctl start grafana-server.service
>>>
>>> Running %posttrans scriptlet: grafana-0:13.1.1-1.x86_64
>>> Finished %posttrans scriptlet: grafana-0:13.1.1-1.x86_64
>>> Scriptlet output:
>>> POSTTRANS: Running script
>>>
Complete!
Step4: Start Grafana Service
Once the installation is completed we need to reloads unit files for the service configuration files changes to take effect and start the grafana service.
admin@linuxser:~$ sudo systemctl daemon-reload
admin@linuxser:~$ sudo systemctl start grafana-server.service
admin@linuxser:~$ sudo systemctl status grafana-server.service
We can validate the grafana process if launched successfully as shown below.
admin@linuxser:~$ ps -ef | grep grafana
grafana     2359       1 13 17:19 ?        00:00:10 /usr/share/grafana/bin/grafana server --config=/etc/grafana/grafana.ini --pidfile=/var/run/grafana/grafana-server.pid --packaging=rpm cfg:default.paths.logs=/var/log/grafana cfg:default.paths.data=/var/lib/grafana cfg:default.paths.plugins=/var/lib/grafana/plugins cfg:default.paths.provisioning=/etc/grafana/provisioning
grafana     2385    2359  0 17:19 ?        00:00:00 /var/lib/grafana/plugins/elasticsearch/gpx_grafana_elasticsearch_datasource_linux_amd64
grafana     2395    2359  0 17:19 ?        00:00:00 /var/lib/grafana/plugins/zipkin/gpx_grafana-zipkin-datasource_linux_amd64
Step5: Validate Grafana Service
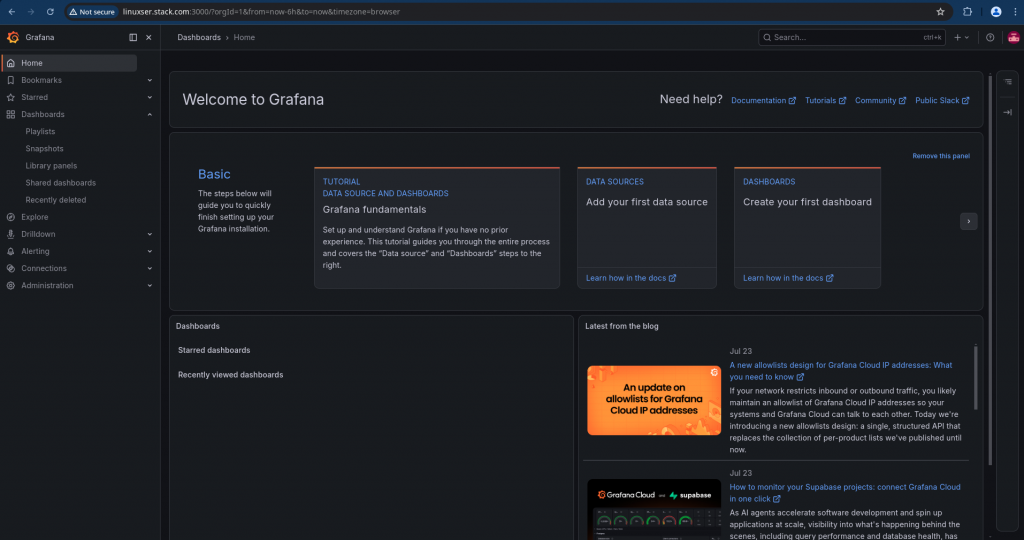
Now we can try to access the grafana portal listening on port “3000”. If you are trying to access the portal for the first time you need to reset the default “admin” user password.
URL: http://linuxser.stack.com:3000/login
user: admin         # default
password: admin     # default
Step6: Create Dashboard
Grafana installation comes with a default datasource which can be used to query and visualize the metrics using the dashboard. So here we are going to create our first dashboard using this default datasource.
- Navigate to Dashboards
- Click on New and Create New Dashboard at the top right corner
- Click on the + icon on right side Panel section to add a new Panel
- Provide a name to your new panel “Grafana_Default”
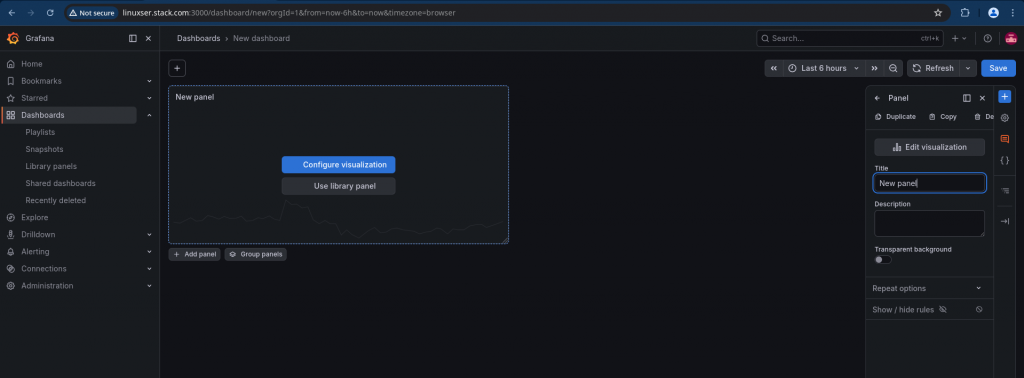
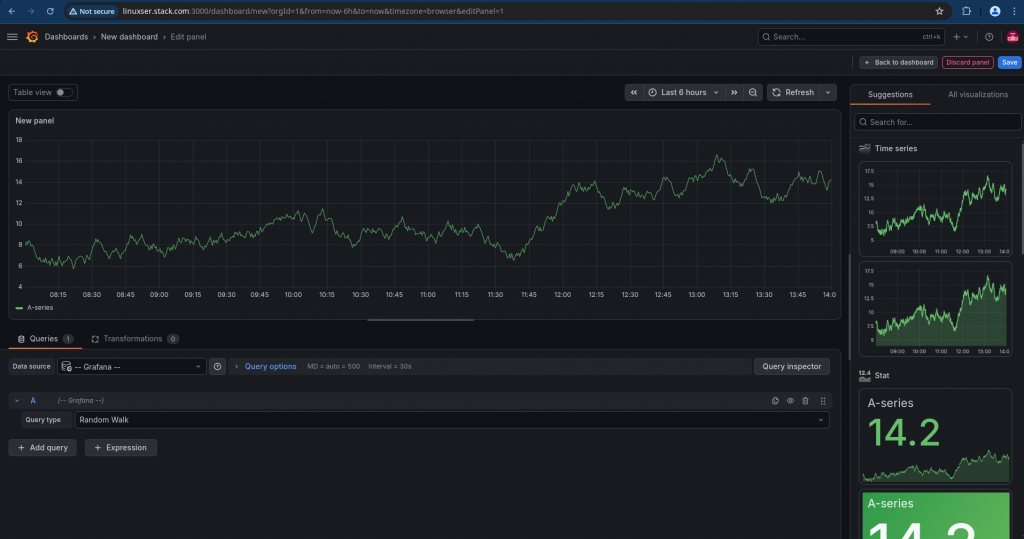
Now click on “Configure Visualization” within the Panel. This will take you the “Edit Panel” page wherein you can select you datasource within the “Queries” section at the bottom left and select the type of visualization that you want to view on the right side bar.
By default you can see that “–Grafana–” datasource is already selected and Query Type is “Random Walk”. In the panel edit pane, select the Time series visualization at the right side bar and Save the settings.
NOTE: The built-in default “–Grafana–” datasource provides fake datasets so you can explore and learn how to use the platform.
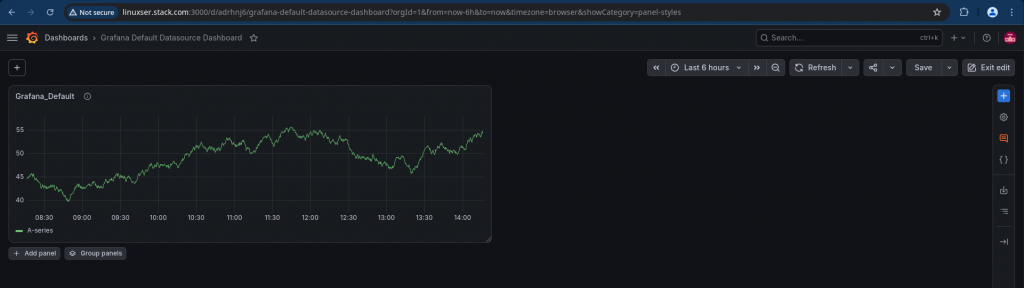
Save your dashboard by providing a title “Grafana Default Dashboard” and exit to list your dashboards and click on your dashboard name that you just created.
Hope you enjoyed reading this article. Thank you..



Related Posts