How to send OpenTelemetry data to OTLP collector and Jaeger Tracing
Here in this article we will see how we can instrument a python flask application using OpenTelemetry to collect the telemetry data. This telemetry data is further transferred to OpenTelemetry collector and exported to Jaeger Tracing platform for analysis and review.
Test Environment
Fedora 39 workstation
Python 3.x
If you are interested in watching the video. Here is the YouTube video on the same step by step procedure outlined below.
Procedure
Step1: Clone and Validate Flask Application
Here we are going to use the sample application provided by Flask documentation. Let’s clone this repository and create a virtual environment to install the required packages for this application to launch. Follow the below steps to install and validate your flask applications.
admin@fedser:telemetry$ git clone https://github.com/pallets/flask
admin@fedser:telemetry$ cd flask/examples/tutorial/
admin@fedser:tutorial$ python -m venv venv
admin@fedser:tutorial$ source venv/bin/activate
(venv) admin@fedser:tutorial$ pip install -e .

(venv) admin@fedser:tutorial$ flask --app flaskr init-db
Initialized the database.

(venv) admin@fedser:tutorial$ flask --app flaskr run
 * Serving Flask app 'flaskr'
 * Debug mode: off
WARNING: This is a development server. Do not use it in a production deployment. Use a production WSGI server instead.
 * Running on http://127.0.0.1:5000
Press CTRL+C to quit
Validate Application
URL - http://127.0.0.1:5000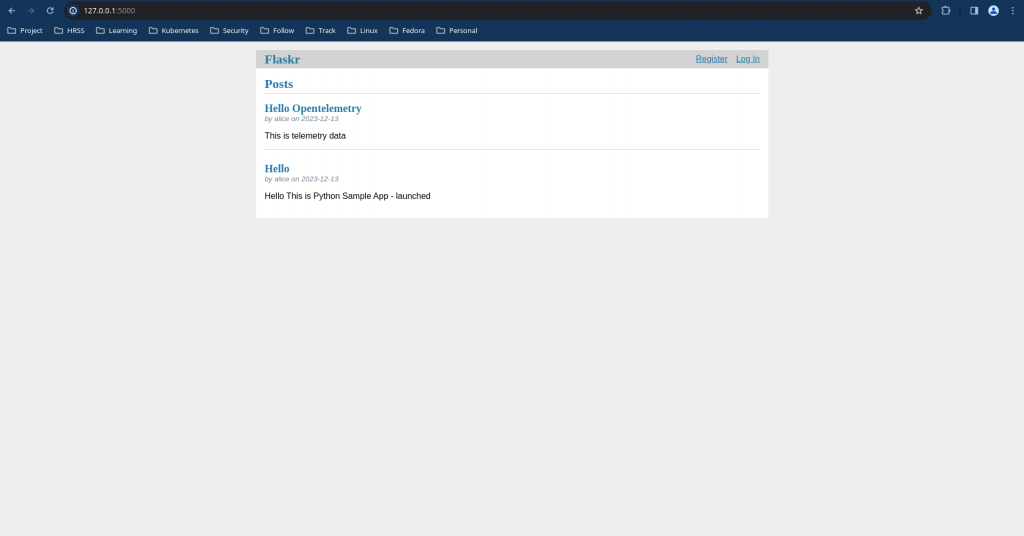
Step2: Install OpenTelemetry Instrumentation Packages
The opentelemetry-distro package installs the API, SDK, and the opentelemetry-bootstrap and opentelemetry-instrument tools. The opentelemetry-bootstrap -a install command reads through the list of packages installed in your active site-packages folder, and installs the corresponding instrumentation libraries for these packages.
(venv) admin@fedser:tutorial$ pip install opentelemetry-distro

(venv) admin@fedser:tutorial$ opentelemetry-bootstrap -a install
Step3: Run Instrumented Application
In this step we are going to run our flask application using the opentelemetry-instrument tool to collect the telemetry data. Also we are going to log the traces, metrics and logs data to console. The service name for our instrumented application is “flask_blog”.
(venv) admin@fedser:tutorial$ opentelemetry-instrument --traces_exporter console --metrics_exporter console --logs_exporter console --service_name flask_blog flask --app flaskr run
Step4: Install OpenTelemetry Exporter Package
Here we are going to install an OpenTelemetry Exporter. This library is provided as a convenience to install all supported OpenTelemetry Collector Exporters. Currently it installs the following exporters.
- opentelemetry-exporter-otlp-proto-grpc
- opentelemetry-exporter-otlp-proto-http
(venv) admin@fedser:tutorial$ pip install opentelemetry-exporter-otlp
The opentelemetry-instrument agent will detect the package you just installed and default to OTLP export when it’s run next. By default, opentelemetry-instrument exports traces and metrics over OTLP/gRPC and will send them to localhost:4317, which is what the collector is listening on.
Step5: Setup and Run OpenTelemetry Collector
Now we need to setup the OpenTelemetry Collector. The OpenTelemetry Collector offers a vendor-agnostic implementation of how to receive, process and export telemetry data. Here we are going to configure collector to recieve data from grpc protocol.
The batch processor is an OpenTelemetry Collector component that batches and compresses spans, metrics, or logs based on size or time.
OTEL Collector Config
(venv) admin@fedser:tutorial$ cat otel-collector-config.yaml
# /tmp/otel-collector-config.yaml
receivers:
  otlp:
    protocols:
      grpc:
exporters:
  # NOTE: Prior to v0.86.0 use `logging` instead of `debug`.
  debug:
    verbosity: detailed
processors:
  batch:
service:
  pipelines:
    traces:
      receivers: [otlp]
      exporters: [debug]
      processors: [batch]
    metrics:
      receivers: [otlp]
      exporters: [debug]
      processors: [batch]
    logs:
      receivers: [otlp]
      exporters: [debug]
      processors: [batch]
OTEL Collector Docker Compose file
(venv) admin@fedser:tutorial$ cat docker-compose.yml
version: "2"
services:

  # Collector
  otel-collector:
    image: otel/opentelemetry-collector:0.88.0
    #restart: always
    command: ["--config=/etc/otel-collector-config.yaml", "${OTELCOL_ARGS}"]
    volumes:
      - ./otel-collector-config.yaml:/etc/otel-collector-config.yaml
    ports:
      - "4317:4317"   # OTLP gRPC receiver
Start the OpenTelemetry collector
(venv) admin@fedser:tutorial$ docker-compose up -d
(venv) admin@fedser:tutorial$ docker-compose ps
          Name                         Command               State                               Ports
-----------------------------------------------------------------------------------------------------------------------------------
tutorial_otel-collector_1   /otelcol --config=/etc/ote ...   Up      0.0.0.0:4317->4317/tcp,:::4317->4317/tcp, 55678/tcp, 55679/tcp
Step6: Re-Run Instrumented Application
Once the OTEL Collector service is up and running, let us launch our instrumented flask application again now by exporting the telemetry data to otlp endpoint rather than console.
(venv) admin@fedser:tutorial$ opentelemetry-instrument --logs_exporter otlp --service_name flask_blog flask --app flaskr run
Here is the output from the collector container logs showing the traces and span telemetry data from the flask application.
admin@fedser:tutorial$ docker logs --follow 405782af3ada
...
2023-12-13T08:13:46.854Z	info	TracesExporter	{"kind": "exporter", "data_type": "traces", "name": "debug", "resource spans": 1, "spans": 4}
2023-12-13T08:13:46.855Z	info	ResourceSpans #0
Resource SchemaURL:
Resource attributes:
     -> telemetry.sdk.language: Str(python)
     -> telemetry.sdk.name: Str(opentelemetry)
     -> telemetry.sdk.version: Str(1.21.0)
     -> service.name: Str(flask_blog)
     -> telemetry.auto.version: Str(0.42b0)
ScopeSpans #0
ScopeSpans SchemaURL:
InstrumentationScope opentelemetry.instrumentation.jinja2 0.42b0
Span #0
    Trace ID       : ef80927d174b370869aabe7a8c2e75df
    Parent ID      : b58805531a48ee21
    ID             : 35e3b46ced0bc74e
    Name           : jinja2.compile
    Kind           : Internal
    Start time     : 2023-12-13 08:13:45.392929004 +0000 UTC
    End time       : 2023-12-13 08:13:45.401316639 +0000 UTC
    Status code    : Unset
    Status message :
Attributes:
     -> jinja2.template_name: Str(blog/create.html)
Stop the OTLP docker compose service once you validate the traces and spans in the Collector container logs. Also stop your flask application.
Step7: Configure Jaeger service
Here we are going to update our docker-compose file with the jaeger service that we want to use. This tool help in proving us with a UI to analyze and review our trace data.
We also need to update the OTEL collector config file exporter backend to be jaeger as shown below. Please note we have configure the Jaeger endpoint as insecure as tls configuration is ignored for this demo. This is not recommended for the production use case.
OTEL Collector Config
(venv) admin@fedser:tutorial$ cat docker-compose.yml
version: "2"
services:

  # Jaeger
  jaeger-all-in-one:
    image: jaegertracing/all-in-one:latest
    #restart: always
    ports:
      - "16686:16686"
      - "14268"
      - "14250"

  # Collector
  otel-collector:
    image: otel/opentelemetry-collector:0.88.0
    #restart: always
    command: ["--config=/etc/otel-collector-config.yaml", "${OTELCOL_ARGS}"]
    volumes:
      - ./otel-collector-config.yaml:/etc/otel-collector-config.yaml
    ports:
      - "4317:4317"   # OTLP gRPC receiver
    depends_on:
      - jaeger-all-in-one
OTEL Collector Docker Compose file
admin@fedser:otel-getting-started$ cat otel-collector-config.yaml
# /tmp/otel-collector-config.yaml
receivers:
  otlp:
    protocols:
      grpc:
exporters:
  # NOTE: Prior to v0.86.0 use `logging` instead of `debug`.
  debug:
    verbosity: detailed
  otlp/jaeger:
    endpoint: jaeger-all-in-one:4317
    tls:
      insecure: true
processors:
  batch:
service:
  pipelines:
    traces:
      receivers: [otlp]
      exporters: [otlp/jaeger]
      processors: [batch]
    metrics:
      receivers: [otlp]
      exporters: [debug]
      processors: [batch]
    logs:
      receivers: [otlp]
      exporters: [debug]
      processors: [batch]
Step8: Start Collector and Jaeger Services
Now we can launch our OTEL Collector and Jaeger services using the docker-compose.yml file as shown below.
(venv) admin@fedser:tutorial$ docker-compose up -d
WARNING: The OTELCOL_ARGS variable is not set. Defaulting to a blank string.
Creating network "tutorial_default" with the default driver
Creating tutorial_jaeger-all-in-one_1 ... done
Creating tutorial_otel-collector_1    ... done
Step9: Start Instrumented Flask application
Let’s now lanch our application flask application and try to access different parts of the application to generate some traffic.
(venv) admin@fedser:tutorial$ opentelemetry-instrument --logs_exporter otlp --service_name flask_blog flask --app flaskr run
 * Serving Flask app 'flaskr'
 * Debug mode: off
WARNING: This is a development server. Do not use it in a production deployment. Use a production WSGI server instead.
 * Running on http://127.0.0.1:5000
Press CTRL+C to quit
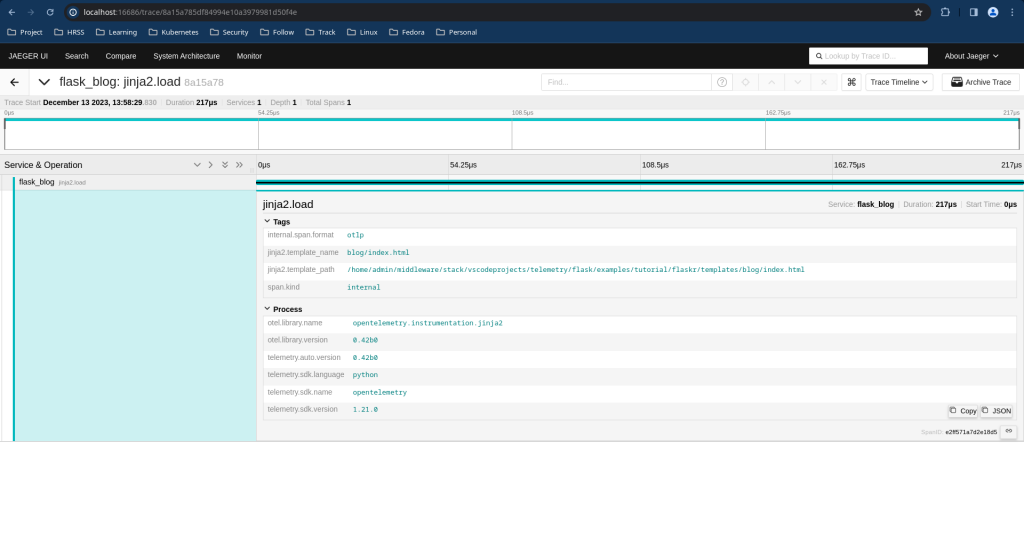
Step10: Launch Jaeger and Validate Traces
Now, we can launch the Jaeger UI and validate our trace data as shown below.
URL - http://localhost:16686/search
Hope you enjoyed reading this article. Thank you..
Leave a Reply
You must be logged in to post a comment.