How to use Opensource Apache APISIX as an API Gateway
Here in this article we are going to install and configure the APISIX services and route the traffic using the API Gateway to backend python flask based microservices applications.
Test Environment
Fedora 37 server
Docker
Docker Compose
curl
What is Apache APISIX
Apache APISIX is an Opensource API Gateway Management tool. It provides us with traffic handling for websites, mobile and IoT applications by providing services such as load balancing, dynamic upstream, canary release, fine-grained routing, rate limiting, and many more. It is a dynamic, scalable and high performance cloud native API gateway for API’s and microservices.
If you are interested in watching the video. Here is the YouTube video on the same step by step procedure outlined below.
Procedure
Step1: Ensure Docker Installed and Running
As a pre-requisite step ensure that docker and docker-compose is installed and running. Also we will required curl for sending the http requests to the API gateway.
[admin@fedser apisix]$ docker -v
Docker version 23.0.1, build a5ee5b1

[admin@fedser apisix]$ docker-compose -v
docker-compose version 1.29.2, build 5becea4c

[admin@fedser apisix]$ curl --version
curl 7.85.0 (x86_64-redhat-linux-gnu) libcurl/7.85.0 OpenSSL/3.0.8 zlib/1.2.12 brotli/1.0.9 libidn2/2.3.4 libpsl/0.21.1 (+libidn2/2.3.3) libssh/0.10.4/openssl/zlib nghttp2/1.51.0
[admin@fedser apisix]$ sudo systemctl status docker.service
[sudo] password for admin:
● docker.service - Docker Application Container Engine
     Loaded: loaded (/usr/lib/systemd/system/docker.service; disabled; preset: disabled)
     Active: active (running) since Tue 2023-02-28 11:53:22 IST; 4h 30min ago
Step2: Launch Microservices Flask Applications
Here in this step we are going to install flask python package and create two flask based microservices applications. These two application will be serving on two different ports 2020 and 2021 with contexts /django and /kivy respectively as shown below.
Ensure flask python package is installed
[admin@fedser apisix]$ mkdir flask; cd flask
[admin@fedser flask]$ pip install Flask
Create two flask based applications
[admin@fedser flask]$ cat hellodjango.py
from flask import Flask

app = Flask(__name__)

@app.route("/django")
def hello_world():
    return "<p>Hello, Django!</p>"
[admin@fedser flask]$ cat hellokivy.py
from flask import Flask

app = Flask(__name__)

@app.route("/kivy")
def hello_world():
    return "<p>Hello, Kivy!</p>"
Launch flask applications
[admin@fedser flask]$ flask --app hellodjango run --host=0.0.0.0 --port=2020 &
[admin@fedser flask]$ flask --app hellokivy run --host=0.0.0.0 --port=2021 &
Verify flask applications
http://192.168.29.117:2020/django
http://192.168.29.117:2021/kivy
NOTE: Replace 192.168.29.117 with your host FQDN
Step3: Create Docker Compose file for APISIX Services
Here we have created a docker-compose.yml file which would launch three APISIX service related components (ie. apisix, apisix-dashboard, etcd). APISIX uses etcd to save and synchronize configuration. Before installing APISIX, you need to install etcd on your machine.
| Service | Ports |
| apisix-dashboard | 9000 |
| apisix | 9180, 9080, 9091, 9443, 9092 |
| etcd | 2379 |
Docker Compose
[admin@fedser apisix]$ cat docker-compose.yml
version: "3"

services:
  apisix-dashboard:
    image: apache/apisix-dashboard:3.0.0-alpine
    restart: always
    volumes:
    - ./dashboard_conf/conf.yaml:/usr/local/apisix-dashboard/conf/conf.yaml
    ports:
    - "9000:9000"
    networks:
      apisix:

  apisix:
    image: apache/apisix:${APISIX_IMAGE_TAG:-3.1.0-debian}
    restart: always
    volumes:
      - ./apisix_conf/config.yaml:/usr/local/apisix/conf/config.yaml:ro
    depends_on:
      - etcd
    ##network_mode: host
    ports:
      - "9180:9180/tcp"
      - "9080:9080/tcp"
      - "9091:9091/tcp"
      - "9443:9443/tcp"
      - "9092:9092/tcp"
    networks:
      apisix:

  etcd:
    image: bitnami/etcd:3.4.15
    restart: always
    volumes:
      - etcd_data:/bitnami/etcd
    environment:
      ETCD_ENABLE_V2: "true"
      ALLOW_NONE_AUTHENTICATION: "yes"
      ETCD_ADVERTISE_CLIENT_URLS: "http://etcd:2379"
      ETCD_LISTEN_CLIENT_URLS: "http://0.0.0.0:2379"
    ports:
      - "2379:2379/tcp"
    networks:
      apisix:

networks:
  apisix:
    driver: bridge

volumes:
  etcd_data:
    driver: local
APISIX Dashboard config
[admin@fedser apisix]$ cat dashboard_conf/conf.yaml
...
conf:
  listen:
    host: 0.0.0.0     # `manager api` listening ip or host name
    port: 9000          # `manager api` listening port
  allow_list:           # If we don't set any IP list, then any IP access is allowed by default.
    - 0.0.0.0/0
  etcd:
    endpoints:          # supports defining multiple etcd host addresses for an etcd cluster
      - "http://etcd:2379"
                          # yamllint disable rule:comments-indentation
                          # etcd basic auth info
    # username: "root"    # ignore etcd username if not enable etcd auth
    # password: "123456"  # ignore etcd password if not enable etcd auth
    mtls:
      key_file: ""          # Path of your self-signed client side key
      cert_file: ""         # Path of your self-signed client side cert
      ca_file: ""           # Path of your self-signed ca cert, the CA is used to sign callers' certificates
    # prefix: /apisix     # apisix config's prefix in etcd, /apisix by default
  log:
    error_log:
      level: warn       # supports levels, lower to higher: debug, info, warn, error, panic, fatal
      file_path:
        logs/error.log  # supports relative path, absolute path, standard output
                        # such as: logs/error.log, /tmp/logs/error.log, /dev/stdout, /dev/stderr
    access_log:
      file_path:
        logs/access.log  # supports relative path, absolute path, standard output
                         # such as: logs/access.log, /tmp/logs/access.log, /dev/stdout, /dev/stderr
                         # log example: 2020-12-09T16:38:09.039+0800	INFO	filter/logging.go:46	/apisix/admin/routes/r1	{"status": 401, "host": "127.0.0.1:9000", "query": "asdfsafd=adf&a=a", "requestId": "3d50ecb8-758c-46d1-af5b-cd9d1c820156", "latency": 0, "remoteIP": "127.0.0.1", "method": "PUT", "errs": []}
  security:
      # access_control_allow_origin: "http://httpbin.org"
      # access_control_allow_credentials: true          # support using custom cors configration
      # access_control_allow_headers: "Authorization"
      # access_control-allow_methods: "*"
      # x_frame_options: "deny"
      content_security_policy: "default-src 'self'; script-src 'self' 'unsafe-eval' 'unsafe-inline'; style-src 'self' 'unsafe-inline'; frame-src *"  # You can set frame-src to provide content for your grafana panel.

authentication:
  secret:
    secret              # secret for jwt token generation.
                        # NOTE: Highly recommended to modify this value to protect `manager api`.
                        # if it's default value, when `manager api` start, it will generate a random string to replace it.
  expire_time: 3600     # jwt token expire time, in second
  users:                # yamllint enable rule:comments-indentation
    - username: admin   # username and password for login `manager api`
      password: admin
    - username: user
      password: user

plugins:                          # plugin list (sorted in alphabetical order)
  - api-breaker
  - authz-keycloak
  - basic-auth
  - batch-requests
  - consumer-restriction
  - cors
  # - dubbo-proxy
  - echo
  # - error-log-logger
  # - example-plugin
  - fault-injection
  - grpc-transcode
  - hmac-auth
  - http-logger
  - ip-restriction
  - jwt-auth
  - kafka-logger
  - key-auth
  - limit-conn
  - limit-count
  - limit-req
  # - log-rotate
  # - node-status
  - openid-connect
  - prometheus
  - proxy-cache
  - proxy-mirror
  - proxy-rewrite
  - redirect
  - referer-restriction
  - request-id
  - request-validation
  - response-rewrite
  - serverless-post-function
  - serverless-pre-function
  # - skywalking
  - sls-logger
  - syslog
  - tcp-logger
  - udp-logger
  - uri-blocker
  - wolf-rbac
  - zipkin
  - server-info
  - traffic-split
APISIX Config
[admin@fedser apisix]$ cat apisix_conf/config.yaml
...
apisix:
  node_listen: 9080              # APISIX listening port
  enable_ipv6: false

  enable_control: true
  control:
    ip: "0.0.0.0"
    port: 9092

deployment:
  admin:
    allow_admin:               # http://nginx.org/en/docs/http/ngx_http_access_module.html#allow
      - 0.0.0.0/0              # We need to restrict ip access rules for security. 0.0.0.0/0 is for test.

    admin_key:
      - name: "admin"
        key: edd1c9f034335f136f87ad84b625c8f1
        role: admin                 # admin: manage all configuration data

      - name: "viewer"
        key: 4054f7cf07e344346cd3f287985e76a2
        role: viewer

  etcd:
    host:                           # it's possible to define multiple etcd hosts addresses of the same etcd cluster.
      - "http://etcd:2379"          # multiple etcd address
    prefix: "/apisix"               # apisix configurations prefix
    timeout: 30                     # 30 seconds

plugin_attr:
  prometheus:
    export_addr:
      ip: "0.0.0.0"
      port: 9091
Step4: Start the APISIX services
Now that our configuration files are ready along with the docker-compose.yml file. Let’s start all the APISIX related services as shown below.
[admin@fedser apisix]$ docker-compose up -d
Creating network "apisix_apisix" with driver "bridge"
Creating volume "apisix_etcd_data" with local driver
Creating apisix_etcd_1             ... done
Creating apisix_apisix-dashboard_1 ... done
Creating apisix_apisix_1           ... done
[admin@fedser apisix]$ docker-compose ps
          Name                         Command               State                                                             Ports
----------------------------------------------------------------------------------------------------------------------------------------------------------------------------------------------
apisix_apisix-dashboard_1   /usr/local/apisix-dashboar ...   Up      0.0.0.0:9000->9000/tcp,:::9000->9000/tcp
apisix_apisix_1             /docker-entrypoint.sh dock ...   Up      0.0.0.0:9080->9080/tcp,:::9080->9080/tcp, 0.0.0.0:9091->9091/tcp,:::9091->9091/tcp,
                                                                     0.0.0.0:9092->9092/tcp,:::9092->9092/tcp, 0.0.0.0:9180->9180/tcp,:::9180->9180/tcp,
                                                                     0.0.0.0:9443->9443/tcp,:::9443->9443/tcp
apisix_etcd_1               /opt/bitnami/scripts/etcd/ ...   Up      0.0.0.0:2379->2379/tcp,:::2379->2379/tcp, 2380/tcp
Step5: Ensure APISIX service running
We can validate whether the APISIX serivce is up and running by the following API request as shown below.
[admin@fedser apisix]$ curl "http://192.168.29.117:9180/apisix/admin/services/" -H 'X-API-KEY: edd1c9f034335f136f87ad84b625c8f1'
{"total":0,"list":[]}
Step6: Create upstreams for two backend flask applications
Upstream is the service to forward your requests to. They can be configured to a Route or abstracted out to an Upstream object.
Request
[admin@fedser apisix]$ curl "http://192.168.29.117:9180/apisix/admin/upstreams/1" \
-H "X-API-KEY: edd1c9f034335f136f87ad84b625c8f1" -X PUT -d '
{
  "type": "roundrobin",
  "nodes": {
    "192.168.29.117:2020": 1
  }
}'
Response
{"key":"\/apisix\/upstreams\/1","value":{"type":"roundrobin","hash_on":"vars","id":"1","update_time":1677584079,"scheme":"http","pass_host":"pass","nodes":{"192.168.29.117:2020":1},"create_time":1677584079}}
Request
[admin@fedser apisix]$ curl "http://192.168.29.117:9180/apisix/admin/upstreams/2" \
-H "X-API-KEY: edd1c9f034335f136f87ad84b625c8f1" -X PUT -d '
{
  "type": "roundrobin",
  "nodes": {
    "192.168.29.117:2021": 2
  }
}'
Response
{"key":"\/apisix\/upstreams\/2","value":{"type":"roundrobin","hash_on":"vars","id":"2","update_time":1677584123,"scheme":"http","pass_host":"pass","nodes":{"127.0.0.1:2021":2},"create_time":1677584123}}
Step7: Create routes for two backend flask applications
Routes specify how requests to APISIX are forwarded to the Upstream. They match a client’s request based on defined rules and loads and executes the configured Plugins.
Request
[admin@fedser apisix]$ curl "http://192.168.29.117:9180/apisix/admin/routes/1" \
-H "X-API-KEY: edd1c9f034335f136f87ad84b625c8f1" -X PUT -d '
{
  "methods": ["GET"],
  "host": "example.com",
  "uri": "/django",
  "upstream_id": "1"
}'
Response
{"key":"\/apisix\/routes\/1","value":{"update_time":1677584365,"status":1,"create_time":1677584365,"uri":"\/django","host":"example.com","priority":0,"id":"1","methods":["GET"],"upstream_id":"1"}}
Request
[admin@fedser apisix]$ curl "http://192.168.29.117:9180/apisix/admin/routes/2" \
-H "X-API-KEY: edd1c9f034335f136f87ad84b625c8f1" -X PUT -d '
{
  "methods": ["GET"],
  "host": "example.com",
  "uri": "/kivy",
  "upstream_id": "2"
}'
Response
{"key":"\/apisix\/routes\/2","value":{"update_time":1677584422,"status":1,"create_time":1677584422,"uri":"\/kivy","host":"example.com","priority":0,"id":"2","methods":["GET"],"upstream_id":"2"}}
Step8: Test the Services
Now that our upstream services are configured and the routes created to route the traffic from APISIX gateway to the Upstream objects. We can validate if we are able to send requests to the APISIX gateway so that the requests are routed appropriately to the backend API upstream services as per the configuration.
[admin@fedser apisix]$ curl -i -X GET "http://192.168.29.117:9080/django" -H "Host: example.com"
192.168.48.4 - - [28/Feb/2023 17:12:59] "GET /django HTTP/1.1" 200 -
HTTP/1.1 200 OK
Content-Type: text/html; charset=utf-8
Content-Length: 21
Connection: keep-alive
Date: Tue, 28 Feb 2023 11:42:59 GMT
Server: APISIX/3.1.0

<p>Hello, Django!</p>
[admin@fedser apisix]$ curl -i -X GET "http://192.168.29.117:9080/kivy" -H "Host: example.com"
192.168.48.4 - - [28/Feb/2023 17:13:20] "GET /kivy HTTP/1.1" 200 -
HTTP/1.1 200 OK
Content-Type: text/html; charset=utf-8
Content-Length: 19
Connection: keep-alive
Date: Tue, 28 Feb 2023 11:43:20 GMT
Server: APISIX/3.1.0

<p>Hello, Kivy!</p>
APISIX will forward the request to http://127.0.0.1:2020/django and http://127.0.0.1:2020/kivy respectively.
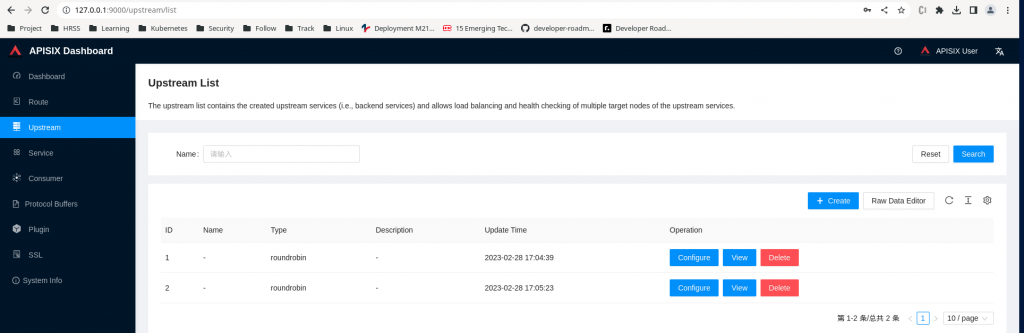
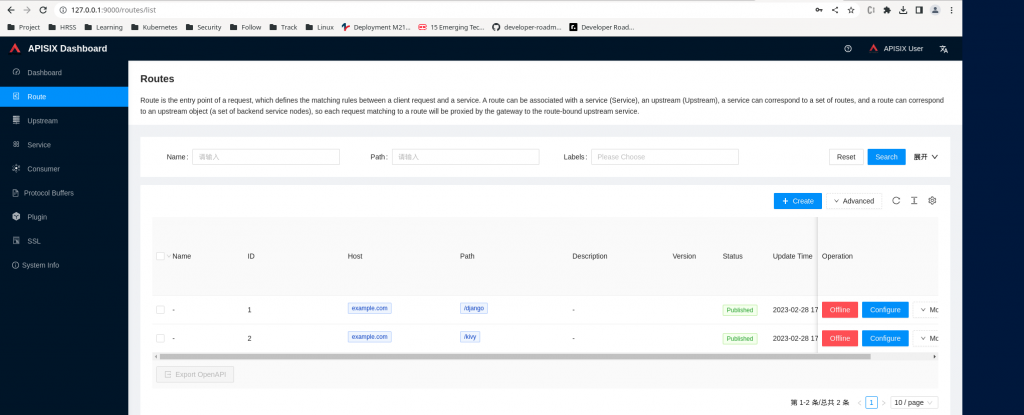
Step9: Validate Upstreams and Route using APISIX Dashboard
We can access the APISIX Dashboard using the following details. Once logged in you can verify the the Routes and Upstreams that we created earlier as shown in below screenshots.
URL - http://192.168.29.117:9000/
username - admin
password - admin
Hope you enjoyed reading this article. Thank you..
Leave a Reply
You must be logged in to post a comment.