How to collect Metrics Data using Metricbeat in Elastic Stack

Here in this article we will see how we can setup elasticstack using Ansible playbook and collect the metric data from the linux system using the metricbeat module. Metricbeat module helps in collecting the relevant information related to system like cpu, memory, disk and network statistics wherein its installed. We can further index this data using elasticsearch and visualize using the kibana dashboard portal.
Test Environment
Fedora 36 server
You can find the complete playbooks and roles related to elasticstack in my github repository for your reference. Currently it still being refactored so there might be changes to the playbooks and roles in future.
If you are interested in watching the video. Here is the YouTube video on the same step by step procedure outlined below.
Procedure
Step1: Install and Configure Elasticsearch service using Ansible
Here in this step we are going to prepare an ansible role to install and configure the elasticsearch service. We will be using elasticsearch to index the metrics data that we are going to collect in the future steps.
Here is my linux_install_elasticsearch_server.yml and the corresponding roles – linux_install_elasticsearch_server directory structure which we will use to install the elasticsearch service.
[admin@fedser elasticstack]$ ls -ltr linux_install_elasticsearch_server.yml
-rw-r--r--. 1 admin admin 146 Jul 22 14:08 linux_install_elasticsearch_server.yml
[admin@fedser elasticstack]$ tree roles/linux_install_elasticsearch_server/
roles/linux_install_elasticsearch_server/
├── files
│   └── elasticsearch.repo
├── tasks
│   └── main.yml
├── templates
│   └── elasticsearch.yml.j2
└── vars
    └── main.yml
This is the playbook from which we are going to call our role named – linux_install_elasticsearch_server.
[admin@fedser elasticstack]$ cat linux_install_elasticsearch_server.yml
---
- name: elasticsearch management
  hosts: sandbox
  become: true
  become_user: root
  roles:
  - {role: 'linux_install_elasticsearch_server'}
We have kept the elasticsearch repository details from where we can download the package in the files section of the role as shown below.
[admin@fedser elasticstack]$ cat roles/linux_install_elasticsearch_server/files/elasticsearch.repo
[elasticsearch]
name=Elasticsearch repository for 8.x packages
baseurl=https://artifacts.elastic.co/packages/8.x/yum
gpgcheck=1
gpgkey=https://artifacts.elastic.co/GPG-KEY-elasticsearch
enabled=0
autorefresh=1
type=rpm-md
We will using the below reference variables in our tasks. Please update the hostname and port as per your requirements on your server.
[admin@fedser elasticstack]$ cat roles/linux_install_elasticsearch_server/vars/main.yml
---
elasticsearch_gpg_key: "https://artifacts.elastic.co/GPG-KEY-elasticsearch"
elasticsearch_port: 9200
elasticsearch_host: fedser36.stack.com
#elasticsearch_ca_cert: /etc/elasticsearch/certs/http_ca.crt
elasticsearch_url: https://fedser36.stack.com:9200
Below is the configuration file elasticsearch.yml which is the core file for elasticsearch service. Here we are updating the network.host to FQDN so that we can access the elasticsearch service using FQDN rather than the default localhost.
[admin@fedser elasticstack]$ cat roles/linux_install_elasticsearch_server/templates/elasticsearch.yml.j2 | grep -v ^#
...
path.data: /var/lib/elasticsearch
path.logs: /var/log/elasticsearch
network.host: "{{ elasticsearch_host }}"


xpack.security.enabled: true

xpack.security.enrollment.enabled: true

xpack.security.http.ssl:
  enabled: true
  keystore.path: certs/http.p12

xpack.security.transport.ssl:
  enabled: true
  verification_mode: certificate
  keystore.path: certs/transport.p12
  truststore.path: certs/transport.p12
cluster.initial_master_nodes: ["fedser36.stack.com"]

http.host: 0.0.0.0
...
Here is the main.yml for our elasticsearch installation which is going to import gpg keys, setup repostory, install package, update the elasticsearch configuration, update firewall to allow elasticsearch port access, reload daemon and start the elastic search service. We are also validating the elasticsearch service url using the basic authentication for which we need to capture the default password when we install elasticsearch for the first time.
[admin@fedser elasticstack]$ cat roles/linux_install_elasticsearch_server/tasks/main.yml
- name: import elasticsearch gpg key
  shell: rpm --import "{{ elasticsearch_gpg_key }}"

- name: configure elasticsearch repository
  copy:
    src: "elasticsearch.repo"
    dest: /etc/yum/repos.d/

- name: enable elasticsearch repository
  shell: dnf config-manager --set-enabled elasticsearch

- name: ensure elasticsearch installed
  dnf:
    name: elasticsearch
    state: present

- name: copy the elasticsearch config
  template:
    src: "elasticsearch.yml.j2"
    dest: "/etc/elasticsearch/elasticsearch.yml"
    owner: root
    group: elasticsearch
    mode: '0660'

- name: reload systemd daemon
  systemd:
    daemon_reload: yes

- name: ensure elasticsearch service is running
  service:
    name: elasticsearch
    state: started

- name: allow elasticsearch port
  firewalld:
    port: "{{ elasticsearch_port }}/tcp"
    permanent: yes
    state: enabled
    immediate: true

- name: validate elasticsearch service
  uri:
    url: "{{ elasticsearch_url }}"
    user: elastic
    password: ifcyGR*4EKlz9*XWj*Fv
    method: GET
    #ca_path: "{{ elasticsearch_ca_cert }}"
    validate_certs: no
  register: escheck_output

- name: print elasticsearch check output
  debug: msg="{{ escheck_output.json }}"
Here is the output of the linux_install_elasticsearch_server.yml playbook execution.
[admin@fedser elasticstack]$ ansible-playbook linux_install_elasticsearch_server.yml -K
BECOME password:

PLAY [elasticsearch management] **************************************************************************************************************************

TASK [Gathering Facts] ***********************************************************************************************************************************
ok: [fedser36.stack.com]

TASK [linux_install_elasticsearch_server : import elasticsearch gpg key] *********************************************************************************
[WARNING]: Consider using the yum, dnf or zypper module rather than running 'rpm'.  If you need to use command because yum, dnf or zypper is insufficient
you can add 'warn: false' to this command task or set 'command_warnings=False' in ansible.cfg to get rid of this message.
changed: [fedser36.stack.com]

TASK [linux_install_elasticsearch_server : configure elasticsearch repository] ***************************************************************************
changed: [fedser36.stack.com]

TASK [linux_install_elasticsearch_server : enable elasticsearch repository] ******************************************************************************
[WARNING]: Consider using the dnf module rather than running 'dnf'.  If you need to use command because dnf is insufficient you can add 'warn: false' to
this command task or set 'command_warnings=False' in ansible.cfg to get rid of this message.
changed: [fedser36.stack.com]

TASK [linux_install_elasticsearch_server : ensure elasticsearch installed] *******************************************************************************
ok: [fedser36.stack.com]

TASK [linux_install_elasticsearch_server : copy the elasticsearch config] ********************************************************************************
ok: [fedser36.stack.com]

TASK [linux_install_elasticsearch_server : reload systemd daemon] ****************************************************************************************
ok: [fedser36.stack.com]

TASK [linux_install_elasticsearch_server : ensure elasticsearch service is running] **********************************************************************
changed: [fedser36.stack.com]

TASK [linux_install_elasticsearch_server : allow elasticsearch port] *************************************************************************************
ok: [fedser36.stack.com]

TASK [linux_install_elasticsearch_server : validate elasticsearch service] *******************************************************************************
ok: [fedser36.stack.com]

TASK [linux_install_elasticsearch_server : print elasticsearch check output] *****************************************************************************
ok: [fedser36.stack.com] => {
    "msg": {
        "cluster_name": "elasticsearch",
        "cluster_uuid": "kVXWWF4WQtGRhljA7EVYaQ",
        "name": "fedser36.stack.com",
        "tagline": "You Know, for Search",
        "version": {
            "build_date": "2022-07-06T15:15:15.901688194Z",
            "build_hash": "8b0b1f23fbebecc3c88e4464319dea8989f374fd",
            "build_snapshot": false,
            "build_type": "rpm",
            "lucene_version": "9.2.0",
            "minimum_index_compatibility_version": "7.0.0",
            "minimum_wire_compatibility_version": "7.17.0",
            "number": "8.3.2"
        }
    }
}

PLAY RECAP ***********************************************************************************************************************************************
fedser36.stack.com         : ok=11   changed=4    unreachable=0    failed=0    skipped=0    rescued=0    ignored=0
Step2: Install and Configure Kibana service using Ansible
Here in this step we are going to prepare an ansible role to install and configure the kibana service. We will be using kibana to discover the indexed metrics data and visualize it using the kibana dashboard.
Here is the playbook and the corresponding role directory structure for kibana installation.
[admin@fedser elasticstack]$ ls -ltr linux_install_kibana_server.yml
-rw-r--r--. 1 admin admin 132 Jul 22 14:06 linux_install_kibana_server.yml

[admin@fedser elasticstack]$ tree roles/linux_install_kibana_server/
roles/linux_install_kibana_server/
├── files
│   └── kibana.repo
├── tasks
│   └── main.yml
├── templates
│   └── kibana.yml.j2
└── vars
    └── main.yml
We will the following playbook – linux_install_kibana_server which will execute the role – linux_install_kibana_server as shown below.
[admin@fedser elasticstack]$ cat linux_install_kibana_server.yml
---
- name: kibana management
  hosts: sandbox
  become: true
  become_user: root
  roles:
  - {role: 'linux_install_kibana_server'}
We are setting up the kibana.repo file with the details from where we are going to download and install the kibana package under the files section of the role.
[admin@fedser elasticstack]$ cat roles/linux_install_kibana_server/files/kibana.repo
[kibana-8.x]
name=Kibana repository for 8.x packages
baseurl=https://artifacts.elastic.co/packages/8.x/yum
gpgcheck=1
gpgkey=https://artifacts.elastic.co/GPG-KEY-elasticsearch
enabled=1
autorefresh=1
type=rpm-md
In vars section of the role we define some custom variables which we will be using in the tasks section of the role.
[admin@fedser elasticstack]$ cat roles/linux_install_kibana_server/vars/main.yml
---
elasticsearch_gpg_key: "https://artifacts.elastic.co/GPG-KEY-elasticsearch"
kibana_port: 5601
kibana_host: fedser36.stack.com
Here is the kibana.yml configuration file which is the core file for the kibana service. In this we are going to update just the server.host with the FQDN of the server so that we can access it from the FQDN.
[admin@fedser elasticstack]$ cat roles/linux_install_kibana_server/templates/kibana.yml.j2 | grep -v ^#
...
server.host: "{{ kibana_host }}"
...
Here is our main.yml for the task where we do the actual installation of the kibana service by setting up the repository, updating the configuration, updating the firewall settings and reloading the daemon and starting the kibana service.
[admin@fedser elasticstack]$ cat roles/linux_install_kibana_server/tasks/main.yml
- name: import elasticsearch gpg key
  shell: rpm --import "{{ elasticsearch_gpg_key }}"

- name: configure kibana repository
  copy:
    src: "kibana.repo"
    dest: /etc/yum/repos.d/

- name: enable elasticsearch repository
  shell: dnf config-manager --set-enabled kibana-8.x

- name: ensure kibana installed
  dnf:
    name: kibana
    state: present
  register: kibana_output

- name: ensure elasticsearch service is running
  service:
    name: elasticsearch
    state: started

- name: generate enrollment token for kibana
  shell: /usr/share/elasticsearch/bin/elasticsearch-create-enrollment-token -s kibana
  register: kibana_token

- name: print kibana enrollment token
  debug: msg="{{ kibana_token.stdout }}"

- name: enroll kibana with elasticsearch
  shell: /usr/share/kibana/bin/kibana-setup --enrollment-token {{ kibana_token.stdout }}
  register: kibana_enrollment

- name: print kibana enrollment output
  debug: msg="{{ kibana_enrollment }}"

- name: reload systemd daemon
  systemd:
    daemon_reload: yes

- name: copy the kibana config
  template:
    src: "kibana.yml.j2"
    dest: "/etc/kibana/kibana.yml"
    owner: root
    group: kibana
    mode: '0660'

- name: ensure kibana service is running
  service:
    name: kibana
    state: started

- name: print kibana installation output
  debug: msg="{{ kibana_output }}"

- name: allow kibana port
  firewalld:
    port: "{{ kibana_port }}/tcp"
    permanent: yes
    state: enabled
    immediate: true
Here is the output of the execution of playbook linux_install_kibana_server as shown below.
[admin@fedser elasticstack]$ ansible-playbook linux_install_kibana_server.yml -K
BECOME password:

PLAY [kibana management] *********************************************************************************************************************************

TASK [Gathering Facts] ***********************************************************************************************************************************
ok: [fedser36.stack.com]

TASK [linux_install_kibana_server : import elasticsearch gpg key] ****************************************************************************************
[WARNING]: Consider using the yum, dnf or zypper module rather than running 'rpm'.  If you need to use command because yum, dnf or zypper is insufficient
you can add 'warn: false' to this command task or set 'command_warnings=False' in ansible.cfg to get rid of this message.
changed: [fedser36.stack.com]

TASK [linux_install_kibana_server : configure kibana repository] *****************************************************************************************
changed: [fedser36.stack.com]

TASK [linux_install_kibana_server : enable elasticsearch repository] *************************************************************************************
[WARNING]: Consider using the dnf module rather than running 'dnf'.  If you need to use command because dnf is insufficient you can add 'warn: false' to
this command task or set 'command_warnings=False' in ansible.cfg to get rid of this message.
changed: [fedser36.stack.com]

TASK [linux_install_kibana_server : ensure kibana installed] *********************************************************************************************
ok: [fedser36.stack.com]

TASK [linux_install_kibana_server : ensure elasticsearch service is running] *****************************************************************************
ok: [fedser36.stack.com]

TASK [linux_install_kibana_server : generate enrollment token for kibana] ********************************************************************************
changed: [fedser36.stack.com]

TASK [linux_install_kibana_server : print kibana enrollment token] ***************************************************************************************
ok: [fedser36.stack.com] => {
    "msg": "eyJ2ZXIiOiI4LjMuMiIsImFkciI6WyIxOTIuMTY4LjEyMi41MDo5MjAwIl0sImZnciI6IjkwMTk4MWJmNDE0MjI3NGU0MmNmN2JhMzNiZTUwMmQyNDRjNmY0ZDE0NTVkMmYxNDFiMjE1ZDBmMjI5ZDAzMDkiLCJrZXkiOiJrVnlaS1lJQl80SFdVUm9hdmx5QjpjMGxORGtOb1R6T1U2bThjblg5SjR3In0="
}

TASK [linux_install_kibana_server : enroll kibana with elasticsearch] ************************************************************************************
changed: [fedser36.stack.com]

TASK [linux_install_kibana_server : print kibana enrollment output] **************************************************************************************
ok: [fedser36.stack.com] => {
    "msg": {
        "changed": true,
        "cmd": "/usr/share/kibana/bin/kibana-setup --enrollment-token eyJ2ZXIiOiI4LjMuMiIsImFkciI6WyIxOTIuMTY4LjEyMi41MDo5MjAwIl0sImZnciI6IjkwMTk4MWJmNDE0MjI3NGU0MmNmN2JhMzNiZTUwMmQyNDRjNmY0ZDE0NTVkMmYxNDFiMjE1ZDBmMjI5ZDAzMDkiLCJrZXkiOiJrVnlaS1lJQl80SFdVUm9hdmx5QjpjMGxORGtOb1R6T1U2bThjblg5SjR3In0=",
        "delta": "0:00:03.652761",
        "end": "2022-07-23 11:18:42.637122",
        "failed": false,
        "rc": 0,
        "start": "2022-07-23 11:18:38.984361",
        "stderr": "- Configuring Kibana...\n✔ Kibana configured successfully.",
        "stderr_lines": [
            "- Configuring Kibana...",
            "✔ Kibana configured successfully."
        ],
        "stdout": "\n\nTo start Kibana run:\n  bin/kibana",
        "stdout_lines": [
            "",
            "",
            "To start Kibana run:",
            "  bin/kibana"
        ]
    }
}

TASK [linux_install_kibana_server : reload systemd daemon] ***********************************************************************************************
ok: [fedser36.stack.com]

TASK [linux_install_kibana_server : copy the kibana config] **********************************************************************************************
changed: [fedser36.stack.com]

TASK [linux_install_kibana_server : ensure kibana service is running] ************************************************************************************
changed: [fedser36.stack.com]

TASK [linux_install_kibana_server : print kibana installation output] ************************************************************************************
ok: [fedser36.stack.com] => {
    "msg": {
        "changed": false,
        "failed": false,
        "msg": "Nothing to do",
        "rc": 0,
        "results": []
    }
}

TASK [linux_install_kibana_server : allow kibana port] ***************************************************************************************************
ok: [fedser36.stack.com]

PLAY RECAP ***********************************************************************************************************************************************
fedser36.stack.com         : ok=15   changed=7    unreachable=0    failed=0    skipped=0    rescued=0    ignored=0
Step3: Install and Configure Metricbeat service using Ansible
Here in this step we are going to install Metricbeat service using the ansible playbook and the corresponding role as shown below.
[admin@fedser elasticstack]$ cat linux_install_metric_beat.yml
---
- name: metricbeat management
  hosts: sandbox
  become: true
  become_user: root
  roles:
  - {role: 'linux_install_metric_beat'}

[admin@fedser elasticstack]$ cat roles/linux_install_metric_beat/tasks/main.yml
- name: ensure metricbeat installed
  dnf:
    name: https://artifacts.elastic.co/downloads/beats/metricbeat/metricbeat-8.3.2-x86_64.rpm
    state: present
This playbook makes sure we have the metricbeat module installed on the server as shown below.
[admin@fedser elasticstack]$ ansible-playbook linux_install_metric_beat.yml -K
BECOME password:

PLAY [metricbeat management] *****************************************************************************************************************************

TASK [Gathering Facts] ***********************************************************************************************************************************
ok: [fedser36.stack.com]

TASK [linux_install_metric_beat : ensure metricbeat installed] *******************************************************************************************
ok: [fedser36.stack.com]

PLAY RECAP ***********************************************************************************************************************************************
fedser36.stack.com         : ok=2    changed=0    unreachable=0    failed=0    skipped=0    rescued=0    ignored=0
Once the metricbeat module is installed we need to update the metricbeat configuration with the elasticsearch and kibana service details which we are going to carry out using this playbook –
linux_metricbeat_config_update.
[admin@fedser elasticstack]$ cat linux_metricbeat_config_update.yml
---
- name: metricbeat management
  hosts: sandbox
  become: true
  become_user: root
  roles:
#  - {role: 'linux_metricbeat_config_backup'}
#  - {role: 'linux_elasticsearch_start_server'}
#  - {role: 'linux_kibana_start_server'}
  - {role: 'linux_metricbeat_config_update'}
  - {role: 'linux_metricbeat_start_server'}
We will update the metricbeat.yml configuration file and enable the linux metrics module as shown below. We need to ensure that elasticsearch and kibana service are up and running before we go ahead and start the metricbeat service.
[admin@fedser elasticstack]$ cat roles/linux_metricbeat_config_update/tasks/main.yml
- name: configure elasticsearch
  template:
    src: "metricbeat.yml.j2"
    dest: /etc/metricbeat/metricbeat.yml
    owner: root
    group: root
    mode: '0600'

- name: enable linux metrics module
  shell: metricbeat modules enable linux

- name: ensure kibana is running
  service:
    name: kibana
    state: started

- name: setup metribeat assets
  shell: metricbeat setup -e
Retrieve the SHA256 fingerprint for the elasticsearch CA certificate as shown below. This is required if you have the elasticsearch configured with a self signed certificate. We will need this details to configure the metricbeat elasticsearch configuration as shown below.
[admin@fedser36 ~]$ sudo openssl x509 -fingerprint -sha256 -in /etc/elasticsearch/certs/http_ca.crt | grep "sha256" | awk -F"=" '{print $2}' | sed -e 's/://g'
901981BF4142274E42CF7BA33BE502D244C6F4D1455D2F141B215D0F229D0309
[admin@fedser elasticstack]$ cat roles/linux_metricbeat_config_update/templates/metricbeat.yml.j2 | grep -v ^#
...
setup.kibana:

  # Kibana Host
  # Scheme and port can be left out and will be set to the default (http and 5601)
  # In case you specify and additional path, the scheme is required: http://localhost:5601/path
  # IPv6 addresses should always be defined as: https://[2001:db8::1]:5601
  #host: "localhost:5601"
  host: "fedser36.stack.com:5601"
  username: "elastic"
  password: "ifcyGR*4EKlz9*XWj*Fv"
  # Kibana Space ID
  # ID of the Kibana Space into which the dashboards should be loaded. By default,
  # the Default Space will be used.
  #space.id:
...
output.elasticsearch:
  # Array of hosts to connect to.
  hosts: ["fedser36.stack.com:9200"]

  # Protocol - either `http` (default) or `https`.
  protocol: "https"

  # Authentication credentials - either API key or username/password.
  #api_key: "id:api_key"
  username: "elastic"
  password: "ifcyGR*4EKlz9*XWj*Fv"
  ssl:
    ca_trusted_fingerprint: "901981BF4142274E42CF7BA33BE502D244C6F4D1455D2F141B215D0F229D0309"
Now, we are going to use the following playbook linux_metricbeat_start_server to start the metricbeat service.
[admin@fedser elasticstack]$ cat linux_metricbeat_start_server.yml
---
- name: metricbeat management
  hosts: sandbox
  become: true
  become_user: root
  roles:
  - {role: 'linux_metricbeat_start_server'}

[admin@fedser elasticstack]$ cat roles/linux_metricbeat_start_server/tasks/main.yml
- name: ensure metricbeat service is running
  service:
    name: metricbeat
    state: started
Here is the output from our linux_metricbeat_config_update.yml playbook which updates the configuration, load the metrics module and carries metricbeat assets setup and start up the metricbeat service.
[admin@fedser elasticstack]$ ansible-playbook linux_metricbeat_config_update.yml -K
BECOME password:
...
TASK [linux_metricbeat_config_update : configure elasticsearch] ******************************************************************************************
ok: [fedser36.stack.com]

TASK [linux_metricbeat_config_update : enable linux metrics module] **************************************************************************************
changed: [fedser36.stack.com]

TASK [linux_metricbeat_config_update : ensure kibana is running] *****************************************************************************************
ok: [fedser36.stack.com]

TASK [linux_metricbeat_config_update : setup metribeat assets] *******************************************************************************************
changed: [fedser36.stack.com]

TASK [linux_metricbeat_start_server : ensure metricbeat service is running] ******************************************************************************
changed: [fedser36.stack.com]

PLAY RECAP ***********************************************************************************************************************************************
fedser36.stack.com         : ok=13   changed=5    unreachable=0    failed=0    skipped=0    rescued=0    ignored=0
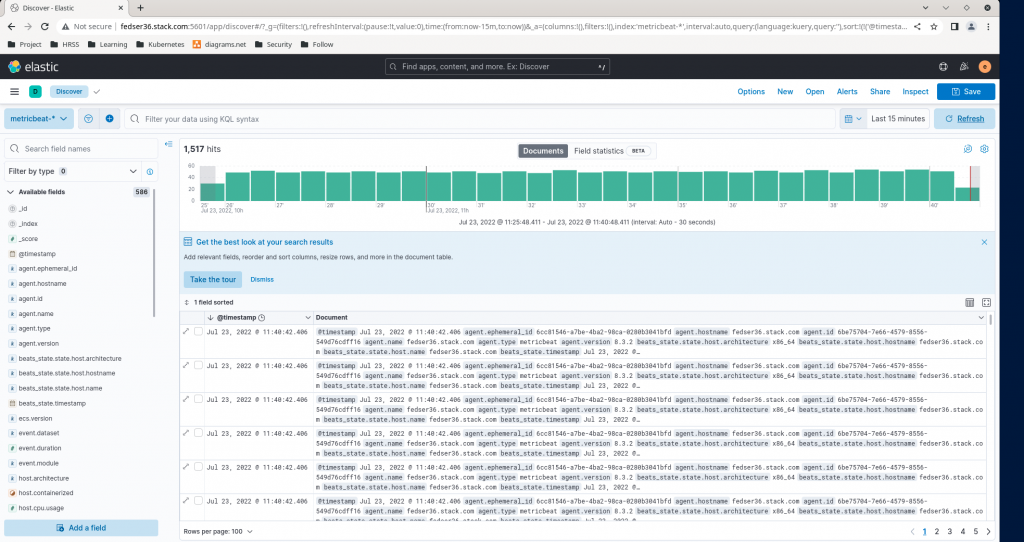
Now you can discover you data in kibana portal under the metricbeat-* index as shown below.
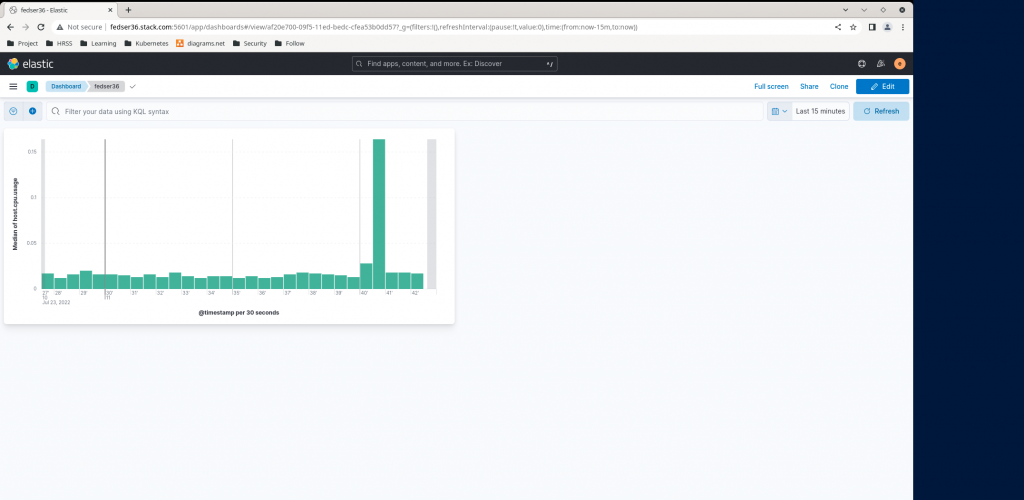
Also you can prepare some graphical representation of your data using the kibana dashboard as shown below.
Hope you enjoyed reading this article. Thank you..
Leave a Reply
You must be logged in to post a comment.