How to install and use Performance Co-Pilot

Here in this article we will see how we can install Performance Co-Pilot (PCP) for collecting performance metrics for local and generate performance charts on the data.
Test Environment
Fedora 35 workstation
What is Performance Co-Pilot (PCP)
Performance Co-Pilot provides a framework and services to support system level performance monitoring and management. It presents a layer of abstraction to the system for collecting the performance data. It provides a set of tools for collecting and processing the performance data.
Procedure
Step1: Create a repository
As a first step create the below repository file which is required for installing the package.
File: /etc/yum.repos.d/performancecopilot.repo
Output:
[performancecopilot]
name=Performance Co-Pilot
baseurl=https://performancecopilot.jfrog.io/artifactory/pcp-rpm-release/fedora/$releasever/$basearch
enabled=1
gpgcheck=0
gpgkey=https://performancecopilot.jfrog.io/artifactory/pcp-rpm-release/fedora/$releasever/$basearch/repodata/repomd.xml.key
repo_gpgcheck=1
Step2: Install Performance Co-Pilot (PCP)
sudo dnf install pcp-zeroconf pcp-gui
Step3: Start the Performance metrics collection service
Before the tool can start collecting the performance metrics we need to make sure the performance metrics collection daemon service is up and running as shown below.
sudo systemctl start pmcd.service
sudo systemctl status pmcd.service
sudo systemctl enable pmcd.service
Step4: List the available performance metrics
Once the collector service is started we can list the performance metrics that can be collected from the local system.
pminfo
Output:
jbd2.njournals
jbd2.transaction.count
jbd2.transaction.requested
jbd2.transaction.max_blocks
jbd2.transaction.total.blocks
jbd2.transaction.total.blocks_logged
jbd2.transaction.total.handles
jbd2.transaction.total.time.waiting
jbd2.transaction.total.time.request_delay
jbd2.transaction.total.time.running
To get a brief information about what a particular metrics collects we can run the below.
pminfo -t kernel.all.uptime
Output:
kernel.all.uptime [time the current kernel has been running]
Step5: Record metrics on local system
sudo systemctl start pmlogger.service
sudo systemctl status pmlogger.service
Verify that the performance metrics logger instance is running as shown below.
pcp
Output:
Performance Co-Pilot configuration on fedser.stack.com:

 platform: Linux fedser.stack.com 5.17.7-200.fc35.x86_64 #1 SMP PREEMPT Thu May 12 14:56:48 UTC 2022 x86_64
 hardware: 8 cpus, 1 disk, 1 node, 15770MB RAM
 timezone: IST-5:30
 services: pmcd
     pmcd: Version 5.3.7-1, 12 agents, 1 client
     pmda: root pmcd proc pmproxy xfs linux nfsclient mmv kvm jbd2
           dm openmetrics
 pmlogger: primary logger: /var/log/pcp/pmlogger/fedser.stack.com/20220531.15.42
Verify that the archive files are getting created as shown below.
ls -ltr /var/log/pcp/pmlogger/fedser.stack.com/
Output:
total 3388
-rw-r--r--. 1 pcp pcp     250 May 31 15:42 Latest
-rw-r--r--. 1 pcp pcp   27603 May 31 15:42 pmlogger.log
-rw-r--r--. 1 pcp pcp  339885 May 31 15:49 20220531.15.42.meta
-rw-r--r--. 1 pcp pcp     712 May 31 15:49 20220531.15.42.index
-rw-r--r--. 1 pcp pcp 3087192 May 31 15:49 20220531.15.42.0
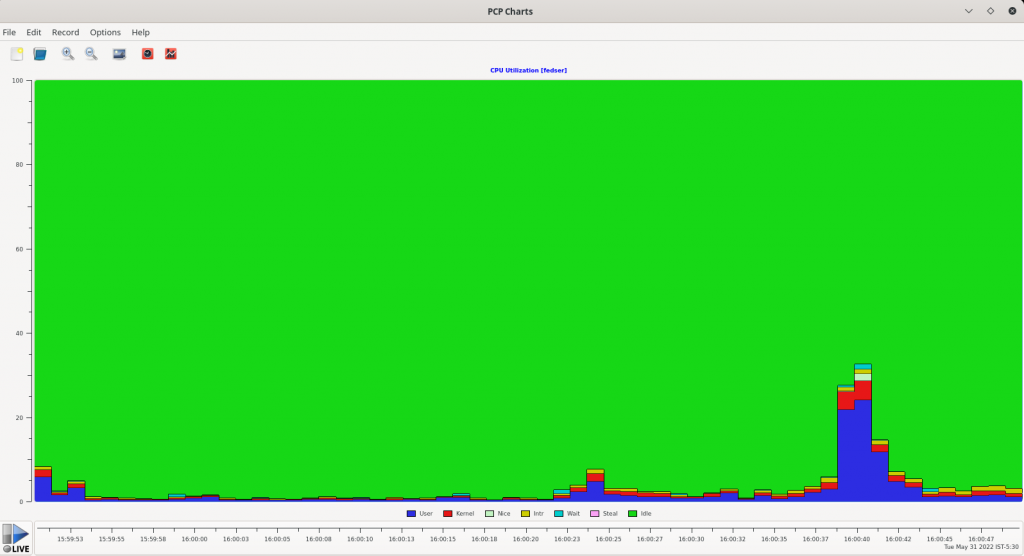
Step6: Generate charts on performance metrics
As a first step we need to launch the below GUI tool for viewing the charts for a collection of metrics and their performance.
pmchart
Once the GUI is loaded we can go into File – Open View which will show some default charts views available for us to view. We can select any one of them and view the performance metrics data live on the GUI as shown below.
Hope you enjoyed reading this article. Thank you..
Leave a Reply
You must be logged in to post a comment.