How to collect and index nginx log using filebeat and elasticsearch
Test Environment
Fedora 32 installed
What is Elasticsearch
Elasticsearch helps in indexing the data read from Logstash. Its a full text search engine. It provides tools to query, access and aggregate the data using the API’s. This tool is based on the Apache Lucene search engine.
What is Kibana
Its used to reads/query data from elasticsearch indices using its API’s. Also we use kibana to visualise and generates graphs and charts for the data that is indexed.
What are Beats
These are lightweight and are installed as agents. THey reads data, parses it and ships it to either elasticsearch or logstash. Metricsbeat, Filebeat and Packetbeat are some of the beats available. ‘libbeat’ is the library which can be used to write custom beat.
Here in this article we will will try to capture the access logs from nginx service using the filebeat service and send it to elasticsearch service for indexing the data. We will be carrying out this activity using filebeat inputs approach available in the tool.
If you are interested in watching the video. Here is the YouTube video on the same step by step procedure outlined below.
Procedure
Step1: Install and Configure Nginx to serve static content
Here in this step we will be installing the nginx service from the fedora repository.
sudo dnf install nginx-1:1.20.0-2.fc32.x86_64
The standard installation of nginx comes with a default ‘/etc/nginx/nginx.conf’ which serves static content from ‘/usr/share/nginx/html’ and writes the access and error logs at the following location ‘/var/log/nginx/access.log’ and ‘/var/log/nginx/error.log’.
Once the package is installed, you can enable and start the nginx service and validate it by requesting the default nginx static content page by hitting the URL as below.
sudo systemctl enable nginx.service
sudo systemctl start nginx.service
URL - http://localhost/
Step2: Install filebeat
Now that we have our source of data i.e nginx service up and running, in this step we will be setting up the filebeat service by installing it from the fedora repositories. Here i am installing the latest available version of filebeat i.e v7.14.1.
sudo dnf install filebeat-7.14.1-1.x86_64
Once the filebeat service is installed, you can enable and start the service as shown below.
sudo systemctl enable filebeat.service
sudo systemctl start filebeat.service
The standard installation of filebeat has its default configuration file at location ‘/etc/filebeat/filebeat.yml’ and the logging location for this service is available at ‘/var/log/filebeat/filebeat’.
Step3: Install elasticsearch
Here we will now install elasticsearch service from the fedora repositories. We will be using elasticsearch to index the nginx log data.
sudo dnf install elasticsearch-7.14.1-1.x86_64
Once the elasticsearch service is installed, you can enable and start the service as shown below.
sudo systemctl enable elasticsearch.service
sudo systemctl start elasticsearch.service
Step4: Install Kibana
Here we will now install kibana service from the fedora repositories. We will be using kibana to visualize the indexed nginx log data.
sudo dnf install kibana-7.14.1-1.x86_64
Once the kibana service is installed, you can enable and start the service as shown below.
sudo systemctl enable kibana.service
sudo systemctl start kibana.service
Step5: Configure filebeat to capture logs from nginx service
Take backup of the existing filebeat.yml file before making any modification to the configuration.
cp /etc/filebeat/filebeat.yml /etc/filebeat/filebeat.yml_original
Once the backup is completed, lets update the filebeat.yml with the below content. Here are the details about the configuration file which i am using.
Filebeat inputs section
We are enabling the filebeat inputs section. Filebeat starts a harvester for each file that it finds under the specified paths. ‘harvester_buffer_size’ is the size in bytes of the buffer that each harvester uses when fetching a file. The default is 16384. You can edit this value as per your logs size. Also, you can see that i am setting a field named log_type which will be the root level fields added additionally to the log data captured. ‘exclude_files’ will ignore all the files ending with .gz.
General section
Here we are setting two new fields named bu and env which will be root level fields added globally to all the data captured.
Output section
Here in this section we are setting the elasticsearch host and port to which we will be sending the log data captured by filebeat for indexing. Please note, if you have security enabled on elasticsearch you need to enable the authenticaiton and provide the credentials and also if HTTPs is enabled you need to enable the protocol setting.
File: /etc/filebeat/filebeat.yml
# ============================== Filebeat inputs ===============================

filebeat.inputs:

- type: log

  # Change to true to enable this input configuration.
  enabled: true

  # Paths that should be crawled and fetched. Glob based paths.
  paths:
    - /var/log/nginx/access.log
  exclude_files: ['.gz$']
  harvester_buffer_size: 131072

  # Optional additional fields. These fields can be freely picked
  # to add additional information to the crawled log files for filtering
  fields_under_root: true
  fields:
    log_type: access_test

# ================================== General ===================================

fields_under_root: true
fields:
  env: testing
  bu: stack

# ================================== Outputs ===================================

output.elasticsearch:
  # Array of hosts to connect to.
  hosts: ["localhost:9200"]

  # Protocol - either `http` (default) or `https`.
  #protocol: "https"
  #ssl.verification_mode: none

  # Authentication credentials - either API key or username/password.
  #api_key: "id:api_key"
  #username: "admin"
  #password: "admin@1234"
Step6: Restart filebeat service
Once the necessary config updates are done we can restart the filebeat service and make sure there are no errors while starting up the service.
sudo systemctl restart filebeat.service
Step7: Restart the elasticsearch service
Lets start the elasticsearch service so that the filebeat is able to output data to elasticsearch to be indexed.
sudo systemctl restart elasticsearch.service
Step8: Validate the indexed data in kibana
Once the elasticsearch and filebeat services are up and running. You can try to hit the nginx for static content to get some log data generated in the access logs.
URL - http://localhost
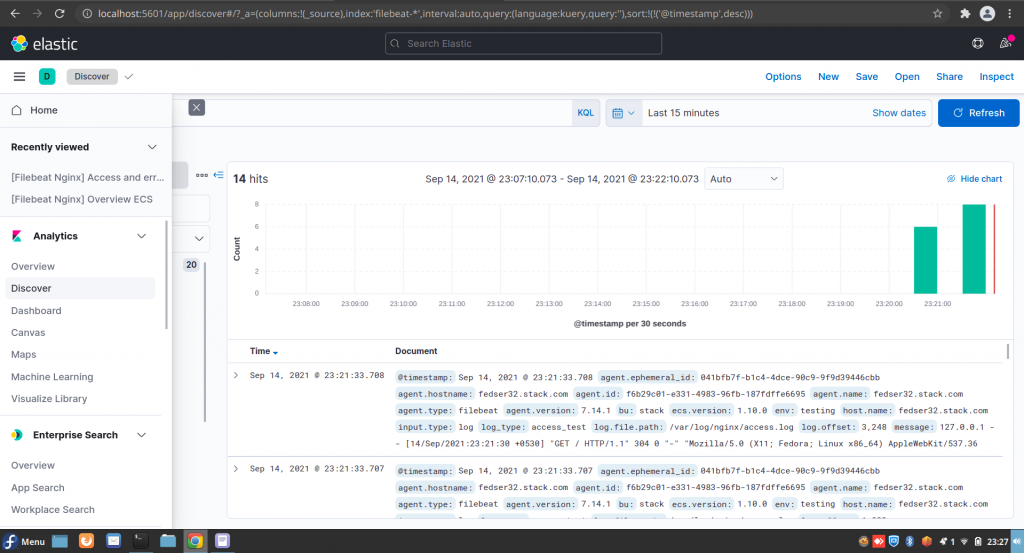
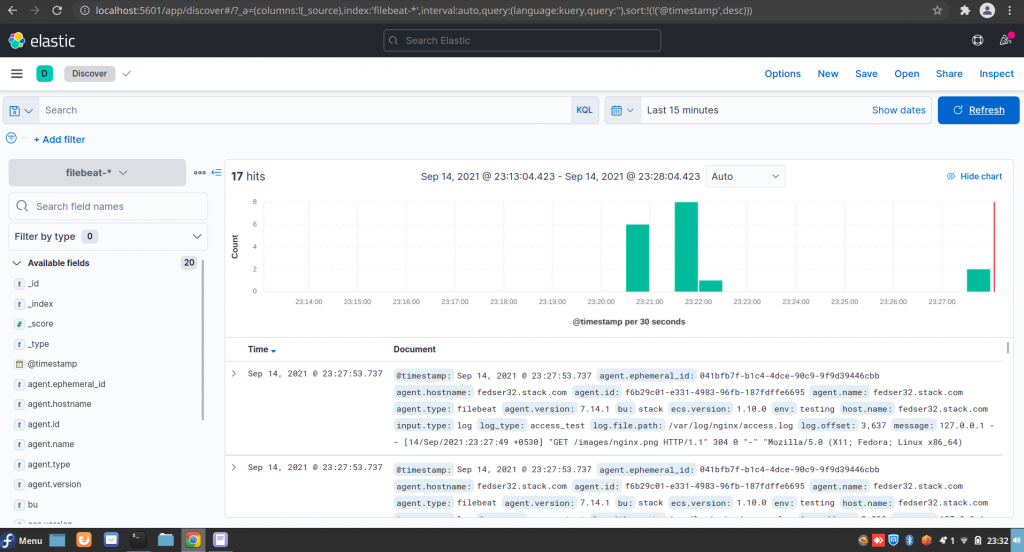
Now we can go to the Kibana portal available at the below url and navigate to Analytics – Discover section in the left navigation menu. You should be able to see the nginx log data indexed under the filebeat-* index pattern as shown below.
URL - http://localhost:5601
Hope you enjoyed reading this article. Thank you..
Leave a Reply
You must be logged in to post a comment.