How to enable and expose Harbor instance metrics

Here in this article, we will enable and expose the Harbor instance metrics which can further be exported to Prometheus and Grafana for reporting and analysis purpose.
Test Environment
Fedora 41 server
Docker version 27.3.1
Docker Compose version v2.29.7
Harbor v2.12.0
Observability
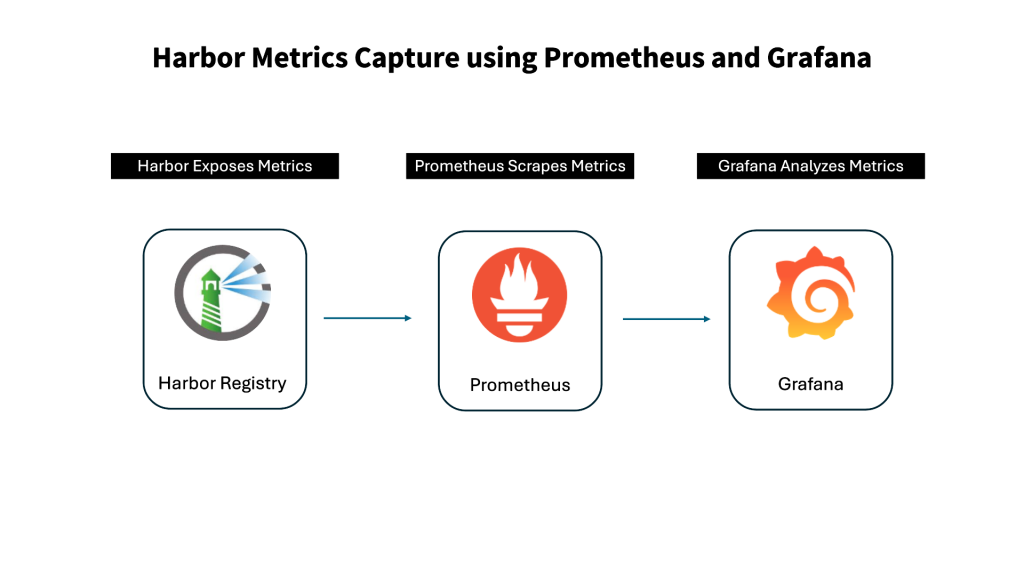
Observability is a key feature for operating a service in production and using this data you can identify abnormal statuses and make informed decisions to fix issues when an error occurs. Harbor exposes metrics using the Prometheus data model so you can easily start scraping your Harbor instance’s metrics using Prometheus.
These metrics provide operators and administrators with real time monitoring data for further analysis and troubleshooting.
Here is the high level architecture diagram for the same.
If you are interested in watching the video. Here is the YouTube video on the same step by step procedure outlined below.
Procedure
Step1: Ensure Harbor service running
As a part of this step ensure that you have a working Harbor service up and running. Please follow “How to setup Harbor registry using Ansible playbook” if you do not have a Harbor service running.
admin@linuxser:~/stack/harbor$ sudo docker compose up -d
Step2: Configure Harbor to enable metrics
Here in this i have updated the harbor configuration file “harbor.yml” to expose its metrics on port “9091” with path “metrics”. Please note on the update to the default port from “9090” to “9091”.
admin@linuxser:~/stack/harbor$ cat harbor.yml
...
metric:
   enabled: true
   port: 9091
   path: /metrics
...
NOTE: Fedora Cockpit service runs on default port 9090.
Step3: Reconfigure Harbor instance
Let’s now reconfigure our Harbor instance using the prepare script. Please pass the required options while re-configuring to ensure they are enabled.
admin@linuxser:~/stack/harbor$ sudo ./prepare --with-trivy
Step4: Restart Harbor instance
Once the Harbor instance configuration is updated we can restart the Harbor instance as below.
admin@linuxser:~/stack/harbor$ sudo docker compose down -v

admin@linuxser:~/stack/harbor$ sudo docker compose up -d
Step5: Validate Harbor metrics
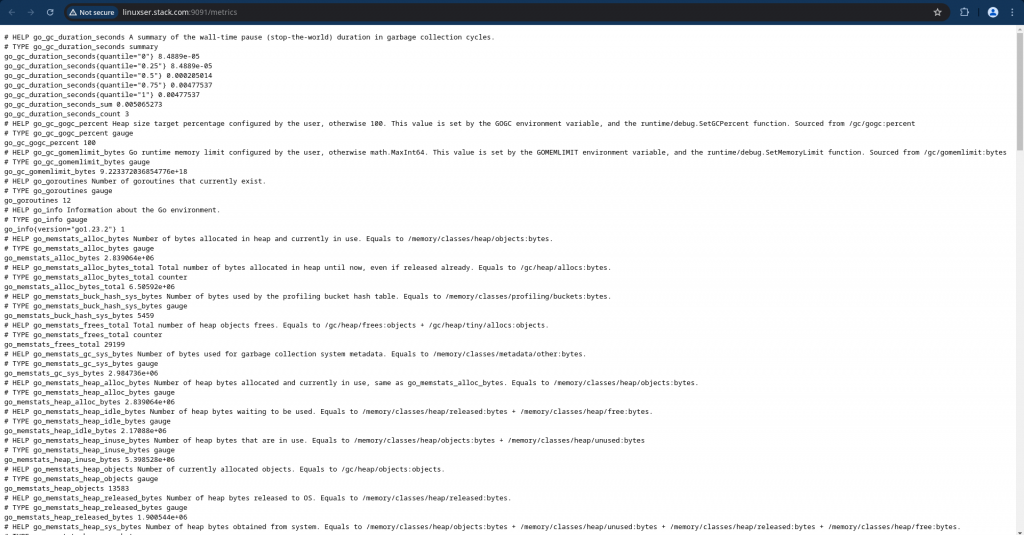
We can now check the exposed metrics from the Harbor metrics endpoint as shown below.
Step6: Setup Prometheus and Grafana service
Here we are going to use the prometheus-grafana docker compose sample.
admin@linuxser:~/stack$ git clone https://github.com/docker/awesome-compose.git
admin@linuxser:~/stack$ cd awesome-compose/prometheus-grafana/
Update prometheus service to listen on port 9092 as shown below
admin@linuxser:~/stack/awesome-compose/prometheus-grafana$ cat compose.yaml
services:
  prometheus:
    image: prom/prometheus
    container_name: prometheus
    command:
      - '--config.file=/etc/prometheus/prometheus.yml'
    ports:
      - 9092:9090
    #restart: unless-stopped
    volumes:
      - ./prometheus:/etc/prometheus
      - prom_data:/prometheus
  grafana:
    image: grafana/grafana
    container_name: grafana
    ports:
      - 3000:3000
    restart: unless-stopped
    environment:
      - GF_SECURITY_ADMIN_USER=admin
      - GF_SECURITY_ADMIN_PASSWORD=grafana
    volumes:
      - ./grafana:/etc/grafana/provisioning/datasources
      - ./grafana/dashboard.yaml:/etc/grafana/provisioning/dashboards/main.yaml
      - ./grafana/dashboards:/var/lib/grafana/dashboards
volumes:
  prom_data:
Update prometheus configuration file as shown below to include all the target metrics endpoints
admin@linuxser:~/stack/awesome-compose/prometheus-grafana$ cat prometheus/prometheus.yml
global:
  scrape_interval: 15s
  scrape_timeout: 10s
  evaluation_interval: 15s
alerting:
  alertmanagers:
  - static_configs:
    - targets: []
    scheme: http
    timeout: 10s
    api_version: v2
scrape_configs:
  - job_name: 'harbor-exporter'
    scrape_interval: 20s
    static_configs:
    # Scrape metrics from the Harbor exporter component
    - targets: ['linuxser.stack.com:9091']

  - job_name: 'harbor-core'
    scrape_interval: 20s
    params:
    # Scrape metrics from the Harbor core component
      comp: ['core']
    static_configs:
    - targets: ['linuxser.stack.com:9091']

  - job_name: 'harbor-registry'
    scrape_interval: 20s
    params:
    # Scrape metrics from the Harbor registry component
      comp: ['registry']
    static_configs:
    - targets: ['linuxser.stack.com:9091']

  - job_name: 'harbor-jobservice'
    scrape_interval: 20s
    params:
    # Scrape metrics from the Harbor jobservice component
      comp: ['jobservice']
    static_configs:
    - targets: ['linuxser.stack.com:9091']
Update grafana datasource configuration file as shown below
admin@linuxser:~/stack/awesome-compose/prometheus-grafana$ cat grafana/datasource.yml
apiVersion: 1

datasources:
- name: Prometheus
  type: prometheus
  url: http://linuxser.stack.com:9092
  isDefault: true
  access: proxy
  editable: true
Update grafana dashboards
admin@linuxser:~/stack/awesome-compose/prometheus-grafana$ cat grafana/dashboard.yaml
apiVersion: 1

providers:
  - name: "Dashboard provider"
    orgId: 1
    type: file
    disableDeletion: false
    updateIntervalSeconds: 10
    allowUiUpdates: false
    options:
      path: /var/lib/grafana/dashboards
      foldersFromFilesStructure: true
Download sample Grafana dashboard configuration json file for Harbor instance
Ref - https://github.com/goharbor/harbor/blob/main/contrib/grafana-dashboard/metrics-example.json
admin@linuxser:~/stack/awesome-compose/prometheus-grafana$ mkdir -p grafana/dashboards
admin@linuxser:~/stack/awesome-compose/prometheus-grafana/grafana/dashboards$ ls -ltr
total 32
-rw-r--r--. 1 admin admin 31631 Dec 15 00:29 main-dashboard.json
Start the prometheus and grafana services as shown below
admin@linuxser:~/stack/awesome-compose/prometheus-grafana$ docker compose up -d
admin@linuxser:~/stack/awesome-compose/prometheus-grafana$ docker compose ps
NAME         IMAGE             COMMAND                  SERVICE      CREATED          STATUS          PORTS
grafana      grafana/grafana   "/run.sh"                grafana      11 minutes ago   Up 11 minutes   0.0.0.0:3000->3000/tcp, :::3000->3000/tcp
prometheus   prom/prometheus   "/bin/prometheus --c…"   prometheus   11 minutes ago   Up 11 minutes   0.0.0.0:9092->9090/tcp, [::]:9092->9090/tcp
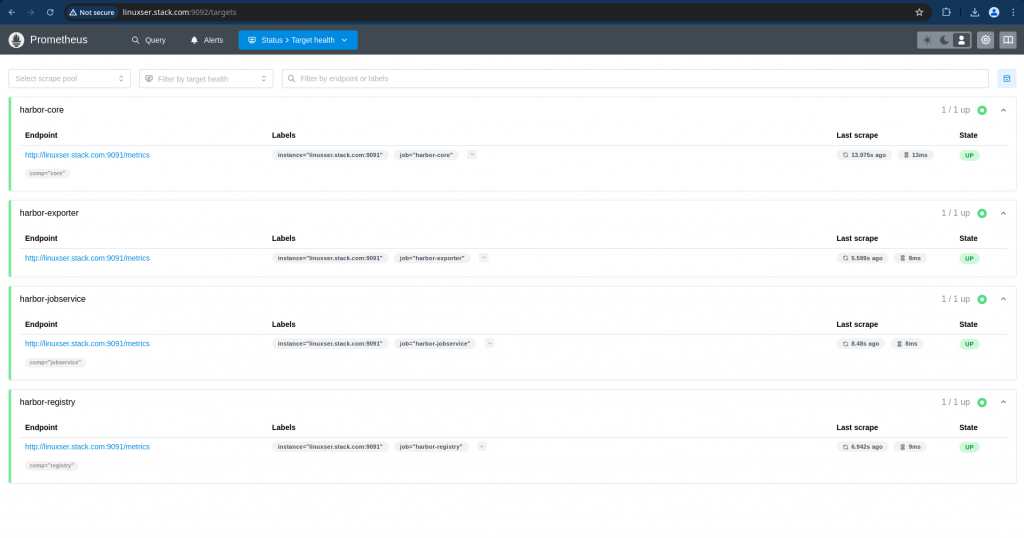
Prometheus Portal - http://linuxser.stack.com:9092/
Check the Prometheus target status.
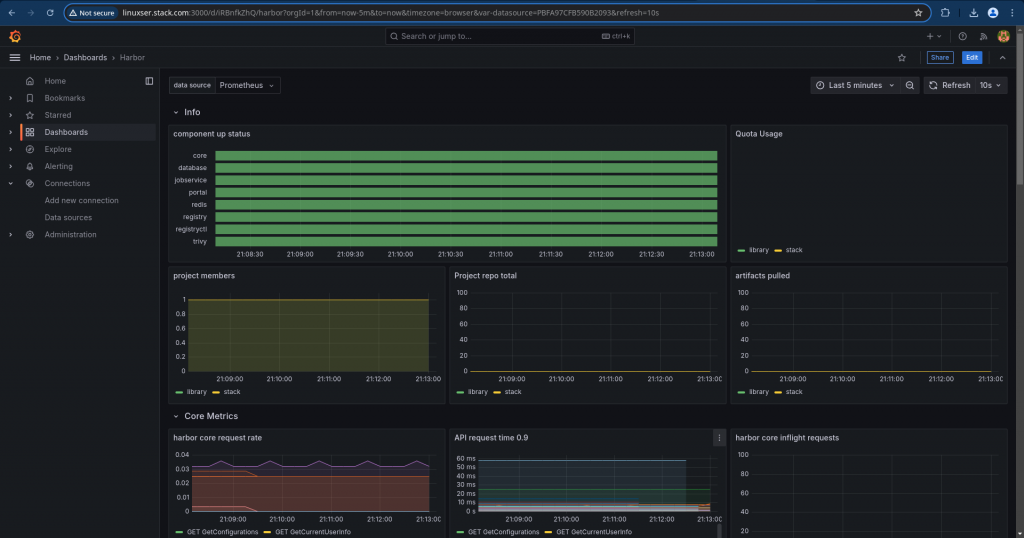
Grafana Portal - http://linuxser.stack.com:3000/
Check the Grafana Harbor dashboard and validate the metrics reports.
Hope you enjoyed reading this article. Thank you..
Leave a Reply
You must be logged in to post a comment.