How to setup log analytics using Opensearch, Data-Prepper and Fluent-bit
Here in this article we will how we can setup log analytics using Opensearch, Data Prepper and Fluentbit tools. We will also be demonstrating the indexing of nginx logs into the Opensearch cluster using fluent=bit and data-prepper.
Test Environment
Fedora 36 server
Docker Engine
What is Log Ingestion
Log ingestion is a way to transform the unstructured log data into structured log data and ingest into Opensearch. This structured log data allows for improved query and filtering based on the data format when searching logs for an event.
Here are the list of components that we are going to discuss about for using log analytics using Opensearch.
| Component | Description |
| FluentBit | It is used as log collector that collects log data from the application and sends it to Data Prepper |
| Data Prepper | It transforms the unstructured log data data into a structured format and sends to Opensearch cluster |
| Opensearch | It is place where the structured log data is indexed for futher search and analytics activities |
| Opensearch Dashboard | It helps in search and analytics of the indexed data and for data visualization |
If you are interested in watching the video. Here is the YouTube video on the same step by step procedure outlined below.
Procedure
Step1: Install and Setup Opensearch
Here in this first step we are going to setup an two node opensearch cluster using a docker-compose.yml file as shown below. We are using the stable version ‘2.3.0’ for the opensearch and opensearch-dashboards services. Also we are persisting the opensearch data using volume mounts opensearch-data1 and opensearch-data2.
File: docker-compose.yml
version: '3'
services:
  opensearch-node1: # This is also the hostname of the container within the Docker network (i.e. https://opensearch-node1/)
    image: opensearchproject/opensearch:2.3.0 # Specifying the latest available image - modify if you want a specific version
    container_name: opensearch-node1
    environment:
      - cluster.name=opensearch-cluster # Name the cluster
      - node.name=opensearch-node1 # Name the node that will run in this container
      - discovery.seed_hosts=opensearch-node1,opensearch-node2 # Nodes to look for when discovering the cluster
      - cluster.initial_cluster_manager_nodes=opensearch-node1,opensearch-node2 # Nodes eligibile to serve as cluster manager
      - bootstrap.memory_lock=true # Disable JVM heap memory swapping
      - "OPENSEARCH_JAVA_OPTS=-Xms512m -Xmx512m" # Set min and max JVM heap sizes to at least 50% of system RAM
    ulimits:
      memlock:
        soft: -1 # Set memlock to unlimited (no soft or hard limit)
        hard: -1
      nofile:
        soft: 65536 # Maximum number of open files for the opensearch user - set to at least 65536
        hard: 65536
    volumes:
      - opensearch-data1:/usr/share/opensearch/data # Creates volume called opensearch-data1 and mounts it to the container
    ports:
      - 9200:9200 # REST API
      - 9600:9600 # Performance Analyzer
    networks:
      - opensearch-net # All of the containers will join the same Docker bridge network
  opensearch-node2:
    image: opensearchproject/opensearch:2.3.0 # This should be the same image used for opensearch-node1 to avoid issues
    container_name: opensearch-node2
    environment:
      - cluster.name=opensearch-cluster
      - node.name=opensearch-node2
      - discovery.seed_hosts=opensearch-node1,opensearch-node2
      - cluster.initial_cluster_manager_nodes=opensearch-node1,opensearch-node2
      - bootstrap.memory_lock=true
      - "OPENSEARCH_JAVA_OPTS=-Xms512m -Xmx512m"
    ulimits:
      memlock:
        soft: -1
        hard: -1
      nofile:
        soft: 65536
        hard: 65536
    volumes:
      - opensearch-data2:/usr/share/opensearch/data
    networks:
      - opensearch-net
  opensearch-dashboards:
    image: opensearchproject/opensearch-dashboards:2.3.0 # Make sure the version of opensearch-dashboards matches the version of opensearch installed on other nodes
    container_name: opensearch-dashboards
    ports:
      - 5601:5601 # Map host port 5601 to container port 5601
    expose:
      - "5601" # Expose port 5601 for web access to OpenSearch Dashboards
    environment:
      OPENSEARCH_HOSTS: '["https://opensearch-node1:9200","https://opensearch-node2:9200"]' # Define the OpenSearch nodes that OpenSearch Dashboards will query
    networks:
      - opensearch-net

volumes:
  opensearch-data1:
  opensearch-data2:

networks:
  opensearch-net:
Once we are reading with out docker compose file we can launch the opensearch and opensearch-dashboard service in detached mode as shown below.
docker-compose up -d
Ensure that you are able to access your opensearch cluster and opensearch dashboard as shown below.
curl -k https://opensearch.stack.com:9200 -u admin:admin
{
  "name" : "opensearch-node1",
  "cluster_name" : "opensearch-cluster",
  "cluster_uuid" : "uJhp7xQfRLSVdoBp114VJQ",
  "version" : {
    "distribution" : "opensearch",
    "number" : "2.3.0",
    "build_type" : "tar",
    "build_hash" : "6f6e84ebc54af31a976f53af36a5c69d474a5140",
    "build_date" : "2022-09-09T00:07:12.137133581Z",
    "build_snapshot" : false,
    "lucene_version" : "9.3.0",
    "minimum_wire_compatibility_version" : "7.10.0",
    "minimum_index_compatibility_version" : "7.0.0"
  },
  "tagline" : "The OpenSearch Project: https://opensearch.org/"
}
Step2: Install and Configure Data Prepper
Data Prepper is an open source data collector for observability data (trace, logs, metrics) that can filter, enrich, transform, normalize, and aggregate data for downstream analysis and visualization. In this step we are going to setup our Data Prepper using the below docker-compose.yml file as shown below. As you can see we are exposing the port 2021 of data-prepper which is used as an http source for collecting the data.
Also we have mounted log_pipeline.yaml file which provides with the information on the source from where the data is coming and the sink where we are going to send out. We use processor to do data transformation. It is similar to logstash pipeline where in we define the input, filter and output plugin information.
File: docker-compose.yml
version: '3'
services:
  data-prepper:
    container_name: data-prepper
    image: opensearchproject/data-prepper:2.0.1
    volumes:
      - ./log_pipeline.yaml:/usr/share/data-prepper/pipelines/log_pipeline.yaml
    ports:
      - 2021:2021
    networks:
      - opensearch-net
networks:
  opensearch-net:
File: log_pipeline.yaml
log-pipeline:
  source:
    http:
      ssl: false
  processor:
    - grok:
        match:
          log: [ "%{COMMONAPACHELOG}" ]
  sink:
    - opensearch:
        hosts: [ "https://opensearch.stack.com:9200" ]
        insecure: true
        username: admin
        password: admin
        index: nginx_logs
Once we are ready with out docker compose file, we can launch our data-prepper service as shown below.
docker-compose up -d
Ensure that the data-prepper service is up and running as shown below.
curl -k http://opensearch.stack.com:2021/log/ingest
Output:
Status: 405
Description: Method Not Allowed
Step3: Install and Configure Fluentbit
Fluent Bit is a super fast, lightweight, and highly scalable logging and metrics processor and forwarder. It is the preferred choice for cloud and containerized environments. In this step we are going to setup our log shipping tool fluentbit using the docker-comppose.yml file as shown below.
As you can see we have mounted fluent-bit.conf which provides information related to input from where it can collect the logs and output which provides the data-prepper instance to which we want to send the raw unstructured data for processing.
File: docker-compose.yaml
version: '3'
services:
  fluent-bit:
    container_name: fluent-bit
    image: fluent/fluent-bit
    volumes:
      - ./fluent-bit.conf:/fluent-bit/etc/fluent-bit.conf
      - /var/log/nginx/access.log:/var/log/access.log
    networks:
      - opensearch-net
networks:
  opensearch-net:
File: fluent-bit.conf
[INPUT]
  name                  tail
  refresh_interval      5
  path                  /var/log/access.log
  read_from_head        true

[OUTPUT]
  Name http
  Match *
  Host opensearch.stack.com
  Port 2021
  URI /log/ingest
  Format json
Once we are ready with the docker compose file for fluent-bit, we can launch the service in detached mode as shown below.
docker-compose up
Ensure that you fluent-bit is started able to collect the logs from the configuration as shown below.
docker-compose logs -f
Output:
Attaching to fluent-bit
fluent-bit    | Fluent Bit v2.0.0
fluent-bit    | * Copyright (C) 2015-2022 The Fluent Bit Authors
fluent-bit    | * Fluent Bit is a CNCF sub-project under the umbrella of Fluentd
fluent-bit    | * https://fluentbit.io
fluent-bit    |
fluent-bit    | [2022/10/27 05:37:42] [ info] [fluent bit] version=2.0.0, commit=08a37a74b2, pid=1
fluent-bit    | [2022/10/27 05:37:42] [ info] [storage] ver=1.3.0, type=memory, sync=normal, checksum=off, max_chunks_up=128
fluent-bit    | [2022/10/27 05:37:42] [ info] [cmetrics] version=0.5.3
fluent-bit    | [2022/10/27 05:37:42] [ info] [ctraces ] version=0.2.5
fluent-bit    | [2022/10/27 05:37:42] [ info] [input:tail:tail.0] initializing
fluent-bit    | [2022/10/27 05:37:42] [ info] [input:tail:tail.0] storage_strategy='memory' (memory only)
fluent-bit    | [2022/10/27 05:37:42] [ info] [output:http:http.0] worker #0 started
fluent-bit    | [2022/10/27 05:37:42] [ info] [sp] stream processor started
fluent-bit    | [2022/10/27 05:37:42] [ info] [output:http:http.0] worker #1 started
fluent-bit    | [2022/10/27 05:37:42] [ info] [input:tail:tail.0] inotify_fs_add(): inode=3328796 watch_fd=1 name=/var/log/access.log
Step4: Run Nginx
Now that we are ready with opensearch cluster, data-prepper backend service, we need to generated some logs and send it to fluent-bit service for log shipping. We will install nginx as a service on the host from which we want to collect the nginx logs. In my case i am using the same host machine where my backend services are setup.
Also, note that you need to setup the fluent-bit service on the respective host where the nginx service is running to collect the nginx logs. In my case it the same host.
Ensure that your nginx service is up and running.
sudo dnf install nginx
sudo systemctl start nginx.service
Ensure that nginx logs are accessible for the user with which you are logged in.
sudo chmod -R 755 /var/log/nginx/
Step5: Access Nginx Application
We will use the default index.html page to access our nginx instance. Here is the url i am using to access the default nginx page for a running nginx instance.
URL - http://opensearch.stack.com/Try hitting this page multiple times to log more data into nginx access.log file and tail the logs for fluent-bit service as shown below. Now you should be able to see that fluent-bit is able to send the nginx log data to data-prepper with a SUCCESS – 200 status.
docker-compose logs -f
Output:
Attaching to fluent-bit
fluent-bit    | Fluent Bit v2.0.0
fluent-bit    | * Copyright (C) 2015-2022 The Fluent Bit Authors
fluent-bit    | * Fluent Bit is a CNCF sub-project under the umbrella of Fluentd
fluent-bit    | * https://fluentbit.io
fluent-bit    |
fluent-bit    | [2022/10/27 05:37:42] [ info] [fluent bit] version=2.0.0, commit=08a37a74b2, pid=1
fluent-bit    | [2022/10/27 05:37:42] [ info] [storage] ver=1.3.0, type=memory, sync=normal, checksum=off, max_chunks_up=128
fluent-bit    | [2022/10/27 05:37:42] [ info] [cmetrics] version=0.5.3
fluent-bit    | [2022/10/27 05:37:42] [ info] [ctraces ] version=0.2.5
fluent-bit    | [2022/10/27 05:37:42] [ info] [input:tail:tail.0] initializing
fluent-bit    | [2022/10/27 05:37:42] [ info] [input:tail:tail.0] storage_strategy='memory' (memory only)
fluent-bit    | [2022/10/27 05:37:42] [ info] [output:http:http.0] worker #0 started
fluent-bit    | [2022/10/27 05:37:42] [ info] [sp] stream processor started
fluent-bit    | [2022/10/27 05:37:42] [ info] [output:http:http.0] worker #1 started
fluent-bit    | [2022/10/27 05:37:42] [ info] [input:tail:tail.0] inotify_fs_add(): inode=3328796 watch_fd=1 name=/var/log/access.log
fluent-bit    | [2022/10/27 05:37:42] [ info] [output:http:http.0] opensearch.stack.com:2021, HTTP status=200
fluent-bit    | 200 OK
fluent-bit    | [2022/10/27 05:37:52] [ info] [output:http:http.0] opensearch.stack.com:2021, HTTP status=200
fluent-bit    | 200 OK
fluent-bit    | [2022/10/27 05:37:56] [ info] [output:http:http.0] opensearch.stack.com:2021, HTTP status=200
fluent-bit    | 200 OK
fluent-bit    | [2022/10/27 05:38:19] [ info] [output:http:http.0] opensearch.stack.com:2021, HTTP status=200
fluent-bit    | 200 OK
You can also tail the logs from the data-prepper service and it is sending data to opensearch cluster for indexing.
docker-compose logs -f
data-prepper    | 2022-10-27T05:38:22,615 [log-pipeline-sink-worker-2-thread-1] INFO  org.opensearch.dataprepper.plugins.sink.opensearch.OpenSearchSink - Sending data to OpenSearch
data-prepper    | 2022-10-27T05:57:47,665 [log-pipeline-processor-worker-1-thread-1] INFO  org.opensearch.dataprepper.pipeline.ProcessWorker -  log-pipeline Worker: Processing 1 records from buffer
data-prepper    | 2022-10-27T05:57:47,671 [log-pipeline-sink-worker-2-thread-1] INFO  org.opensearch.dataprepper.plugins.sink.opensearch.OpenSearchSink - Sending data to OpenSearch
data-prepper    | 2022-10-27T08:50:08,641 [log-pipeline-processor-worker-1-thread-1] INFO  org.opensearch.dataprepper.pipeline.ProcessWorker -  log-pipeline Worker: Processing 1 records from buffer
data-prepper    | 2022-10-27T08:50:08,678 [log-pipeline-sink-worker-2-thread-1] INFO  org.opensearch.dataprepper.plugins.sink.opensearch.OpenSearchSink - Sending data to OpenSearch
data-prepper    | 2022-10-27T08:50:12,609 [log-pipeline-processor-worker-1-thread-1] INFO  org.opensearch.dataprepper.pipeline.ProcessWorker -  log-pipeline Worker: Processing 1 records from buffer
data-prepper    | 2022-10-27T08:50:12,615 [log-pipeline-sink-worker-2-thread-1] INFO  org.opensearch.dataprepper.plugins.sink.opensearch.OpenSearchSink - Sending data to OpenSearch
data-prepper    | 2022-10-27T08:50:16,608 [log-pipeline-processor-worker-1-thread-1] INFO  org.opensearch.dataprepper.pipeline.ProcessWorker -  log-pipeline Worker: Processing 1 records from buffer
data-prepper    | 2022-10-27T08:50:16,612 [log-pipeline-sink-worker-2-thread-1] INFO  org.opensearch.dataprepper.plugins.sink.opensearch.OpenSearchSink - Sending data to OpenSearch
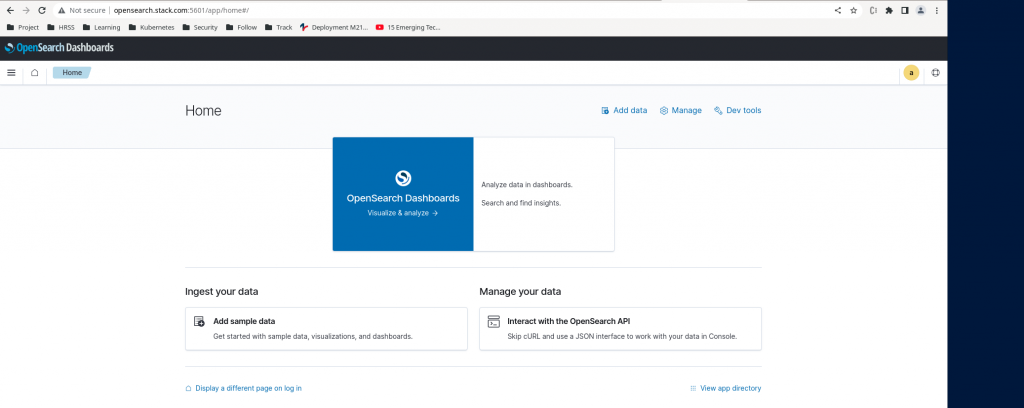
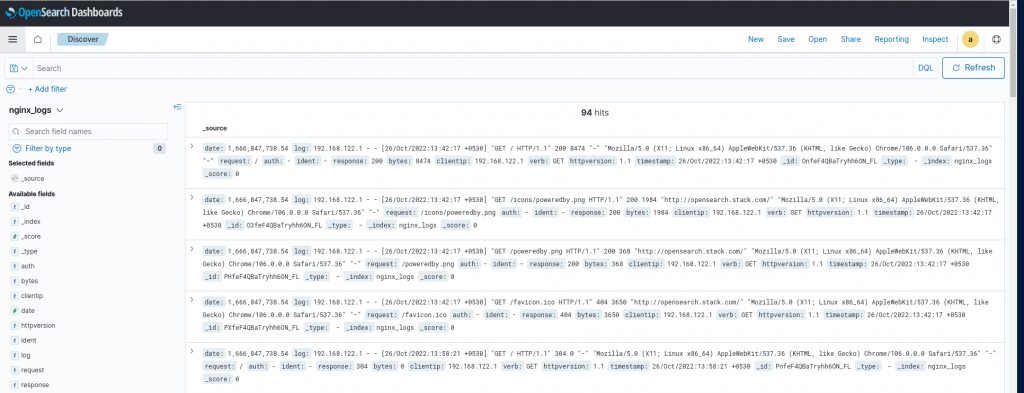
Finally, head into OpenSearch Dashboards (http://opensearch.stack.com:5601) to view your processed logs. You will need to create an index pattern for the index provided in your pipeline.yaml in order to see them. You can do this by going to Stack Management -> Index Pattterns. Now start typing in the name of the index you sent logs to (in this guide it was nginx_logs), and you should see that the index pattern matches 1 source. Click Create Index Pattern, and you should then be able to go back to the Discover tab to see your processed logs as shown below.
Hope you enjoyed reading this article. Thank you..
Leave a Reply
You must be logged in to post a comment.