How to monitor nginx workload using AWS CloudWatch
Here in this article we will try to deploy an AWS EC2 with nginx service and try to monitor its metrics using the AWS cloudwatch.
AWS CloudWatch
Amazon CloudWatch is a monitoring and observability service that collects logs, metrics, and events from your AWS resources and applications in real time. It acts as a unified dashboard to track system health, trigger automated alerts, and optimize infrastructure performance in real-time.
AWS CloudWatch Agent
The CloudWatch agent is a software component that collects metrics, logs, and traces from your Amazon EC2 instances, on-premises servers, and containerized applications. It enables you to monitor your infrastructure and applications more comprehensively than the basic monitoring provided by default.
AWS System Manager Agent
The SSM Agent is a small program that lets you securely manage your EC2 instances without needing an open SSH port. It works like a bridge. It receives commands from the AWS Cloud and runs them on your virtual server.
High Level Architecture
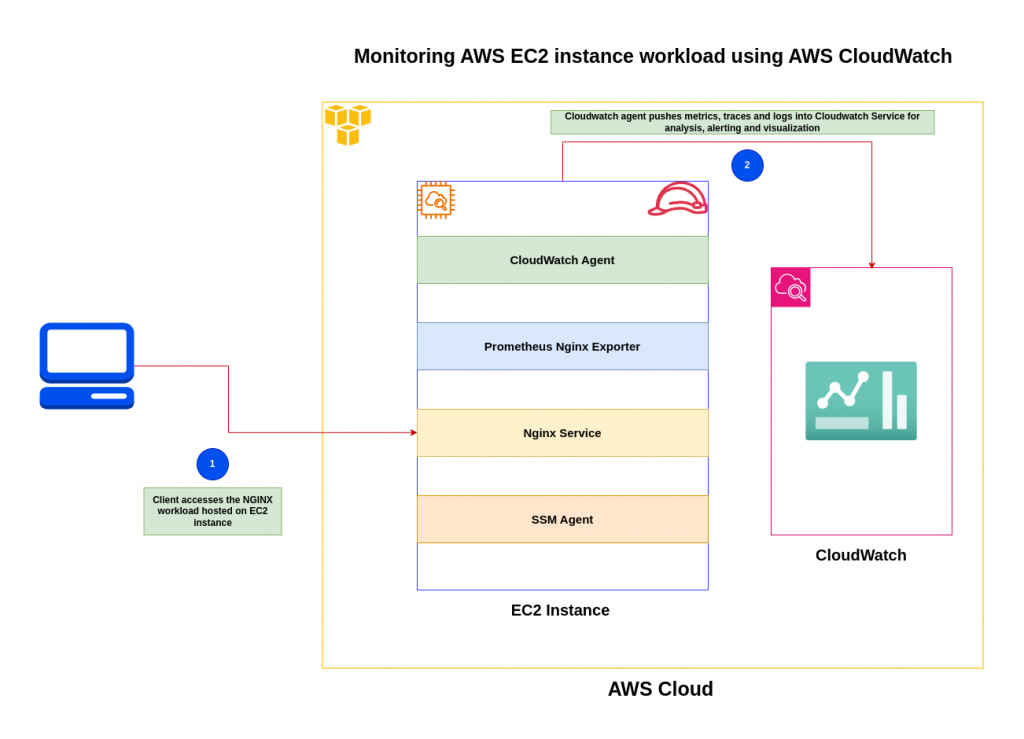
If you are interested in watching the video. Here is the YouTube video on the same step by step procedure outlined below.
Procedure
Step1: Instantiate Nginx service on EC2 instance
As a first step let’s instantiate a very basic Amazon EC2 instance. Here i am instantiating an t2-medium instance.
name: nginxser
ami: ami-01edba92f9036f76e (Free tier eligible)
instance type: t2-medium
Ensure that you have security group attached which allows HTTP (ie. port 80) and SSH (ie. port 22) for this demo and also have got the required key-pair for the same.
$ ssh -i your_private_key.pem ec2-user@your_ec2_instance_public_ip
First ensure that SSM agent is installed on this instance.
$ sudo systemctl status amazon-ssm-agent
Now lets install nginx package on this instance and start up the service.
$ sudo dnf install nginx
$ sudo systemctl start nginx.service
Once the service is up and running you can access it using the EC2 instance public ip address as shown below.
URL: http://your_public_ip_address/

The next thing that we need to do is expose nginx metrics. By default most of the nginx binaries come with a status module included which can be verified as shown below.
$ nginx -V 2>&1 | grep -o with-http_stub_status_module
with-http_stub_status_module
Now, lets update the nginx config to expose the metrics on particular endpoint. The default nginx configuration file is at “/etc/nginx/nginx.conf”.
        location /nginx_status {
          stub_status on;
          allow 127.0.0.1; # Allow only localhost to access
          deny all; # Deny all other IPs
        }
Let’s validate the nginx configuration and reload the nginx service.
$ sudo nginx -t
nginx: the configuration file /etc/nginx/nginx.conf syntax is ok
nginx: configuration file /etc/nginx/nginx.conf test is successful

$ sudo systemctl reload nginx
Verify the nginx_status endpoint as shown below which is accessible locally on the EC2 instance.
$ curl http://127.0.0.1/nginx_status
Active connections: 1
server accepts handled requests
 7 7 4
Reading: 0 Writing: 1 Waiting: 0
Step2: Install Nginx prometheus exporter
Here we are going to download, extract and install the nginx prometheus exporter.
$ cd /tmp
$ wget https://github.com/nginxinc/nginx-prometheus-exporter/releases/download/v1.3.0/nginx-prometheus-exporter_1.3.0_linux_amd64.tar.gz
$ tar -xzvf nginx-prometheus-exporter_1.3.0_linux_amd64.tar.gz
$ sudo cp nginx-prometheus-exporter /usr/local/bin/
$ rm /tmp/nginx-prometheus-exporter*
Let’s now start the nginx prometheus exporter by pointing the nginx_status page as shown below and verify the background process.
$ nohup /usr/local/bin/nginx-prometheus-exporter -nginx.scrape-uri http://127.0.0.1/nginx_status &>/dev/null &
$ ps -ef | grep exporter
ec2-user   27611   27128  0 11:12 pts/0    00:00:00 /usr/local/bin/nginx-prometheus-exporter -nginx.scrape-uri http://127.0.0.1/nginx_status
We can if the nginx proemtheus is exposingthe nginx metrics as shown below. The default port for nginx prometheus export is 9113.
$ curl http://127.0.0.1:9113/metrics
# HELP go_gc_duration_seconds A summary of the pause duration of garbage collection cycles.
# TYPE go_gc_duration_seconds summary
go_gc_duration_seconds{quantile="0"} 0
go_gc_duration_seconds{quantile="0.25"} 0
go_gc_duration_seconds{quantile="0.5"} 0
go_gc_duration_seconds{quantile="0.75"} 0
go_gc_duration_seconds{quantile="1"} 0
go_gc_duration_seconds_sum 0
go_gc_duration_seconds_count 0
# HELP go_goroutines Number of goroutines that currently exist.
# TYPE go_goroutines gauge
go_goroutines 10
# HELP go_info Information about the Go environment.
# TYPE go_info gauge
go_info{version="go1.22.5"} 1
# HELP go_memstats_alloc_bytes Number of bytes allocated and still in use.
# TYPE go_memstats_alloc_bytes gauge
go_memstats_alloc_bytes 226400
# HELP go_memstats_alloc_bytes_total Total number of bytes allocated, even if freed.
# TYPE go_memstats_alloc_bytes_total counter
go_memstats_alloc_bytes_total 226400
Step3: Associate a Role
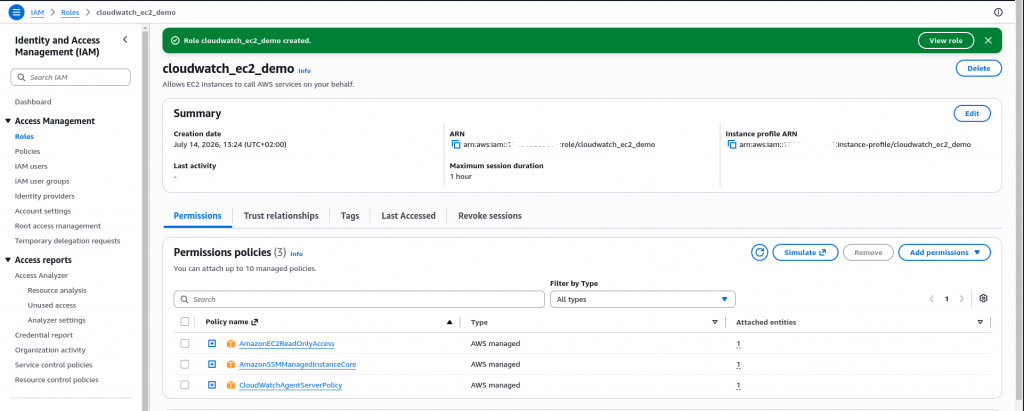
Create a role named “cloudwatch_ec2_demo” with the following permissions policy to be granted to the EC2 instance.
- Grant permissions for Systems Manager to install and configure the CloudWatch agent
- Grant permission for the CloudWatch agent to publish telemetry from your EC2 instance to CloudWatch
- Grant the CloudWatch agent EC2 read access. EC2 read access is required for the EC2 InstanceId to be added as a metric dimension.
Step4: Store CloudWatch agent configuration file in SSM Parameter Store
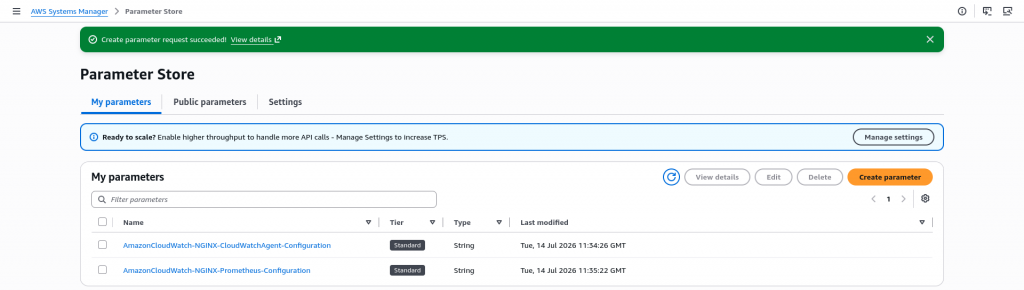
Here we will be creating two parameter stores in AWS System Manager for the prometheus configuraiton file and cloudwatch agent configuraiton file as shown below.
Prometheus configuration file
global:
  scrape_interval: 30s
  scrape_timeout: 10s

scrape_configs:
- job_name: 'nginx'
  metrics_path: /metrics
  static_configs:
    - targets: ['127.0.0.1:9113']
  ec2_sd_configs:
    - port: 9113
  relabel_configs:
    - source_labels: ['__meta_ec2_instance_id']
      target_label: InstanceId
  metric_relabel_configs:
    - source_labels: ['__name__']
      regex: 'nginx_up|nginx_http_requests_total|nginx_connections_.*'
      action: keep
Cloudwatch agent configuraiton file
{
"agent": {
  "metrics_collection_interval": 60
},
"logs": {
  "metrics_collected": {
      "prometheus": {
          "log_group_name": "nginx",
          "prometheus_config_path": "/opt/aws/amazon-cloudwatch-agent/etc/prometheus.yaml",
          "emf_processor": {
              "metric_declaration_dedup": true,
              "metric_namespace": "CWAgent",
              "metric_declaration":[
                  {
                      "source_labels":["InstanceId"],
                      "metric_selectors":["nginx_up", "nginx_http_requests_total", "nginx_connections*"],
                      "dimensions": [["InstanceId"]]
                  }
              ]
          }
      }
  }
}
}
Step5: Install CloudWatch agent using the AWS SSM Parameter Store
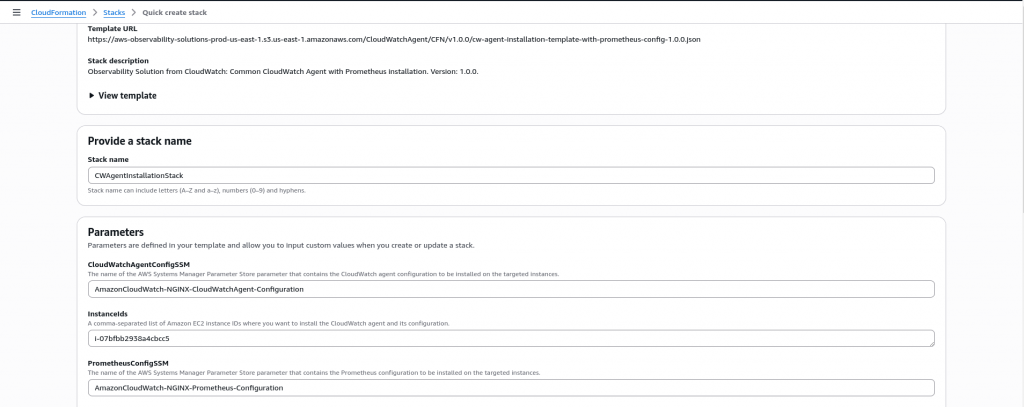
So, here we are going to use the below cloudformation templated to provision our EC2 instance with the cloudwatch agent.
Step6: Validate CloudWatch Agent setup
$ sudo /opt/aws/amazon-cloudwatch-agent/bin/amazon-cloudwatch-agent-ctl -m ec2 -a status
{
  "status": "running",
  "starttime": "2026-07-14T11:52:47+00:00",
  "configstatus": "configured",
  "version": "1.300069.0b1529"
}
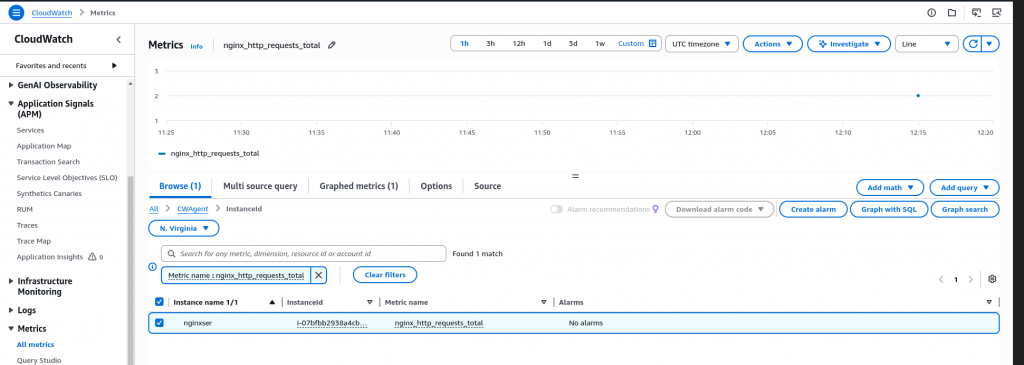
Step7: Validate Nginx metrics in CloudWatch
Now you should be able to see the nginx metrics within cloudwatch under custom namespace (ie. CWAgent) as shown below.
Hope you enjoyed reading this article. Thank you..


Related Posts