How to setup Prometheus Push Gateway to collect metrics

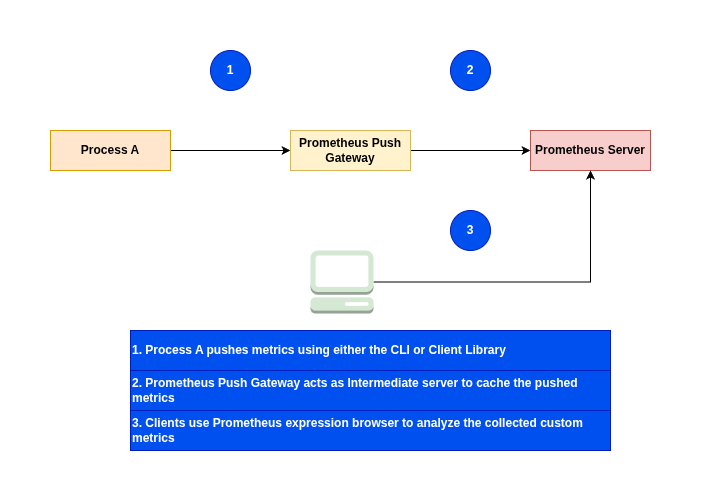
Here in this article we will try to setup Prometheus Push Gateway which acts intermediate server collecting metrics from short lived server level batch jobs and further scraped by the Prometheus server.
Test Environment
- Fedora 41 server
- Docker
- Docker Compose
- Prometheus
What is Prometheus Push Gateway
A prometheus server by default works in the Pull based mode, where in it scrapes the metrics from its target list. But there may be situations where in we want to collect metrics from short lived jobs or services. In this case the Prometheus Push Gateway comes into picture.
The Prometheus Pushgateway allows you to push time series from short-lived service-level batch jobs to an intermediary job which Prometheus can scrape. With a simple text-based exposition format, it is even possible to instrument the shell scripts without a client library.
If you are interested in watching the video. Here is the YouTube video on the same step by step procedure outlined below.
Procedure
Step1: Ensure Docker and Docker installed
As a first step ensure that you have docker installed and running on the system. Follow official docker documentation pages to install the same.
Ensure that the docker daemon service is up and running.
admin@linuxscratch:~$ sudo systemctl start docker.service
admin@linuxscratch:~$ sudo systemctl status docker.service
Step2: Instantiate Prometheus Push Gateway
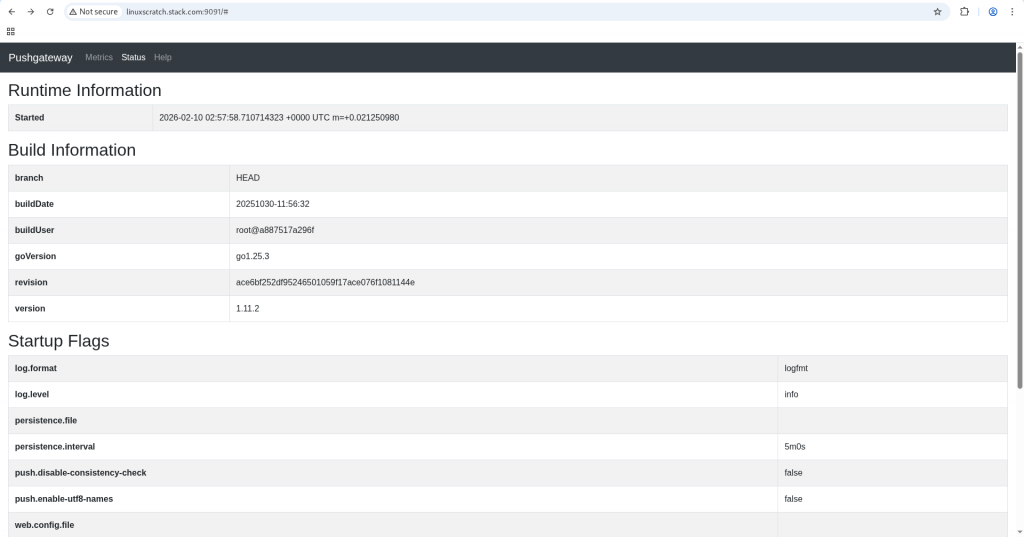
Here in this step we are going to instantiate prometheus push gateway intermediate server listening on port 9091.
The Prometheus Pushgateway exists to allow ephemeral and batch jobs to expose their metrics to Prometheus. Since these kinds of jobs may not exist long enough to be scraped, they can instead push their metrics to a Pushgateway. The Pushgateway then exposes these metrics to Prometheus.
admin@linuxscratch:~$ docker run -d -p 9091:9091 prom/pushgateway
Validate Promethes Push Gateway is up and running.
URL: http://linuxscratch.stack.com:9091/#
Step3: Instantiate Prometheus Server
In this step we are going to instantiate prometheus service with a custom configuration file which defines the static targets that needs to scraped.
admin@linuxscratch:~$ mkdir pushgateway_prometheus
admin@linuxscratch:~$ cd pushgateway_prometheus/
Here is the prometheus custom configuration which uses static configuration to discover its targets manually and scrape the metrics. In this case its the push gateway server listening on port 9091 and exposing metrics on “/metrics” would be scraped by the promethes server.
Ensure that you always set honor_labels: true in the scrape config so that the prometheus server respects the labels already present in the metrics exposed by the target, rather than overwriting them with server-side defaults (such as job and instance).
admin@linuxscratch:~/pushgateway_prometheus$ cat prometheus-config.yaml
global:
  scrape_interval: 15s # Set the scrape interval to every 15 seconds. Default is every 1 minute.
  evaluation_interval: 15s # Evaluate rules every 15 seconds. The default is every 1 minute.

scrape_configs:
  - job_name: "prometheus-pushgateway"
    honor_labels: true
    static_configs:
      - targets: ["linuxscratch.stack.com:9091"]
Here is the docker compose file with custom prometheus config volume mounted.
admin@linuxscratch:~/pushgateway_prometheus$ cat docker-compose.yml
services:
  prometheus:
    image: prom/prometheus:v3.2.1
    command:
      - --config.file=/config/prometheus-config.yaml
    volumes:
      - ./prometheus-config.yaml:/config/prometheus-config.yaml:ro
    ports:
      - "9090:9090"
Let’s now start up the prometheus service.
admin@linuxscratch:~/pushgateway_prometheus$ docker compose up -d
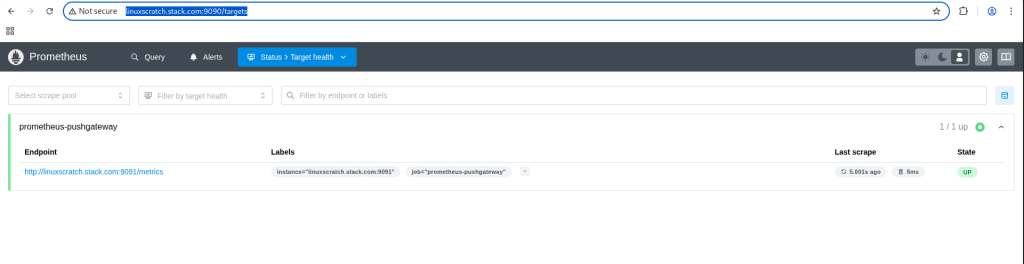
Validate the target health status of prometheus pushgateway in the prometheus server web portal.
URL: http://linuxscratch.stack.com:9090/targets
Step4: Push metrics
Lets try to create sample metrics.txt file which contains some metrics in the prometheus compatible format as shown below.
Prometheus compatible metrics use a line-based, text-oriented format comprising a metric name, optional key-value labels, and a numerical value, typically exposed via HTTP on a /metrics endpoint. Key types include Counters (monotonic increases), Gauges (fluctuating values), Histograms (buckets), and Summaries.
admin@linuxscratch:~/pushgateway_prometheus$ cat metrics.txt
# HELP files_processed_total Total number of files processed.
# TYPE files_processed_total counter
files_processed_total{job="fileprocessor",instance="linuxscratch.stack.com"} 1212
The basic format of the Prometheus Pushgateway URL for pushing metrics is as shown below. The required components in the below url are.
- Push Gateway Host
- Push Gateway Port
- Job name
- Instance name (Optional)
http://<pushgateway-host>:<port>/metrics/job/<job_name>[/instance/<instance_name>]
Let’s now now to push some metrics using the curl cli tool by passing the metrics.txt file to the push gateway server as shown below.
admin@linuxscratch:~/pushgateway_prometheus$ curl --data-binary @metrics.txt http://linuxscratch.stack.com:9091/metrics/job/fileprocessor/instance/process_a
Now let’s try to push without providing the instance name which is optional. In this case the instance name is picked up from the metrics.txt file defined as labels.
admin@linuxscratch:~/pushgateway_prometheus$ curl --data-binary @metrics.txt http://linuxscratch.stack.com:9091/metrics/job/fileprocessor/
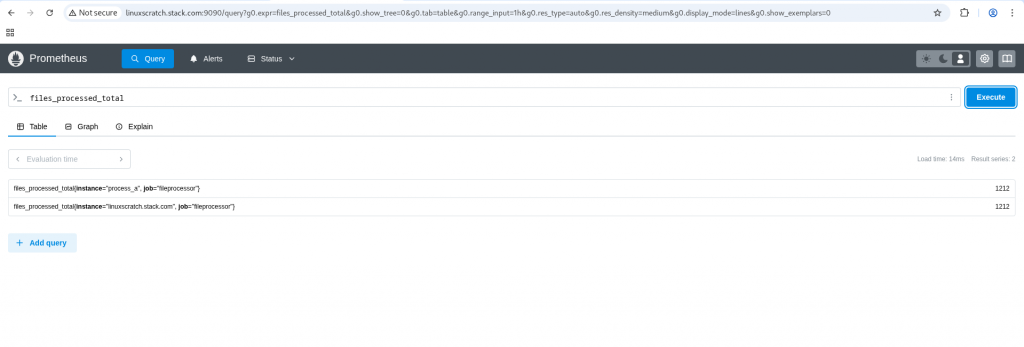
Step5: Validate Push metrics in Prometheus
Now let’s navigate to the prometheus expression browser and query for the metric “files_processed_total” and validate the two timeseries data being captured as shown below.
Hope you enjoyed reading this article. Thank you..
Leave a Reply
You must be logged in to post a comment.