How to integrate Prometheus with Cortex remote storage
Here in this article we will try to integrate Prometheus with Cortex a horizontally scalable, highly available, multi-tenant, long-term storage solution for Prometheus and OpenTelemetry Metrics.
Test Environment
- Fedora 41 server
- Docker v28.4.0
- Docker Compose v2.39.2
- Prometheus v3.9.1
- Cortex v1.20.1
- Seaweedfs v3.67
- Grafana v10.4.2
Prometheus Local Storage
Prometheus by default stores the scraped metrics in a time series database (ie. TSDB) on the local filesystem. But this default local storage setup has some limitation in terms of Scalability and Durability of the node on which Prometheus server is running.
Limitations
- Scalability: Single-node scalability (vertical scaling) refers to increasing a single server’s capacity by adding CPU, RAM, or storage to handle higher loads, which is often limited by physical hardware maximums on the server.
- Durability: Durability on a single node means data persistence through local, reliable storage, but it poses a significant risk as a single point of failure.
In order to mitigate these limitations, Prometheus offers a set of interfaces in the form of API’s that allow integrating with remote storage systems.
Prometheus integrates with remote storage systems in four ways as documentation on Remote storage integrations.
- Prometheus can write samples that it ingests to a remote URL in a Remote Write format.
- Prometheus can receive samples from other clients in a Remote Write format.
- Prometheus can read (back) sample data from a remote URL in a Remote Read format .
- Prometheus can return sample data requested by clients in a Remote Read format .
Cortex Remote Storage Integration
Cortex is a horizontally scalable, highly available, multi-tenant, long-term storage solution for Prometheus and OpenTelemetry Metrics.
Features
- Horizontally Scalable: It can run as cluster of multiple machines exceeding the throughput and storage of a single machine.
- High Availability: The metrics data can be replicated between multiple machines within a cluster providing High Avaiability and mitigating single point of failure issue.
- Multitenant: It provides with isolation of data and queries from multiple different independent Prometheus sources in a single cluster.
- Long term storage: It supports S3, GCS, Swift and Microsoft Azure for long-term storage of metric data.
High Level Architecture
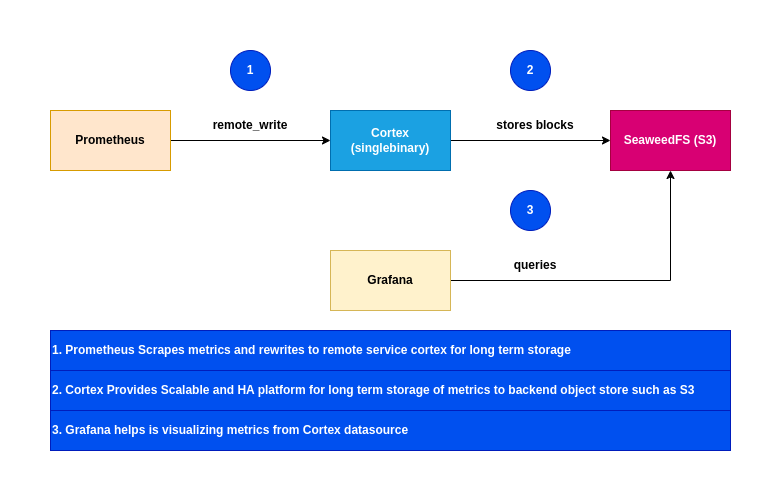
If you are interested in watching the video. Here is the YouTube video on the same step by step procedure outlined below.
Procedure
Step1: Ensure Docker and Docker installed
As a first step ensure that you have docker installed and running on the system. Follow official docker documentation pages to install the same.
Ensure that the docker daemon service is up and running.
admin@linuxscratch:~$ sudo systemctl start docker.service
admin@linuxscratch:~$ sudo systemctl status docker.service
Step2: Instantiate seaweedfs s3 compatible storage
Seaweedfs is a s3 compatible object storage for storing metric blocks. Here we are going pass a custom config file named “seaweedfs-config.json” to define static Identity and Access Management (IAM) configurations, including user credentials and permissions.
admin@linuxscratch:~$ mkdir cortex_seaweedfs
admin@linuxscratch:~$ cd cortex_seaweedfs/
admin@linuxscratch:~/cortex_seaweedfs$ cat seaweedfs-config.json
{
  "identities": [
    {
      "name": "cortex",
      "credentials": [
        {
          "accessKey": "any",
          "secretKey": "any"
        }
      ],
      "actions": [
        "Admin"
      ]
    }
  ]
}
Below is a initialization script used to create S3 bucket in SeaweedFS using the weed shell CLI tool. The following buckets are create as a part of this initialization.
- cortex-blocks
- cortex-ruler
- cortex-alertmanager
admin@linuxscratch:~/cortex_seaweedfs$ cat seaweedfs-init.sh
#!/bin/sh
set -e
while ! wget -qO- http://127.0.0.1:8333/status; do
  sleep 10
done
echo "s3.bucket.create -name cortex-blocks; s3.bucket.create -name cortex-ruler; s3.bucket.create -name cortex-alertmanager"|/usr/bin/weed -logtostderr=true shell
Here is the docker compose file with custom config file and initialization script to start up the seaweedfs service.
admin@linuxscratch:~/cortex_seaweedfs$ cat docker-compose.yml
services:
  seaweedfs:
    image: chrislusf/seaweedfs:3.67
    command:
      - server
      - -s3
      - -s3.config=/workspace/seaweedfs-config.json
    ports:
      - "8333:8333"
    post_start:
      - command: /seaweedfs-init.sh
    volumes:
      - ./seaweedfs-config.json:/workspace/seaweedfs-config.json:ro
      - ./seaweedfs-init.sh:/seaweedfs-init.sh:ro
Let’s start up the seaweedfs service as shown below.
admin@linuxscratch:~/cortex_seaweedfs$ docker compose up -d
Validate the list of buckets that are created under the seaweedfs service as shown below.
admin@linuxscratch:~/cortex_seaweedfs$ curl --aws-sigv4 "aws:amz:local:seaweedfs" --user "any:any" http://linuxscratch.stack.com:8333
<?xml version="1.0" encoding="UTF-8"?>
<ListAllMyBucketsResult xmlns="http://s3.amazonaws.com/doc/2006-03-01/"><Owner><DisplayName></DisplayName><ID></ID></Owner><Buckets><Bucket><CreationDate>2026-02-04T06:45:59Z</CreationDate><Name>cortex-alertmanager</Name></Bucket><Bucket><CreationDate>2026-02-04T06:45:59Z</CreationDate><Name>cortex-blocks</Name></Bucket><Bucket><CreationDate>2026-02-04T06:45:59Z</CreationDate><Name>cortex-ruler</Name></Bucket></Buckets></ListAllMyBucketsResult>
NOTE: Modern versions of curl support AWS Signature V4 directly, which handles the complex signing process for SeaweedFS S3 APIs.
Step3: Instantiate Cortex in Single Binary mode
Here in this step let’s create a custom cortex-config.yaml which is used to manage various aspects of a Cortex deployment. These are some of the key components defined in the configuration file.
- Storage Configuration: Defines where to store Prometheus metrics (e.g., S3, GCS, Azure, Cassandra).
- Ingester and Querier Settings: Controls data ingestion, replication factors, and query parallelization.
- Limits and Quotas: Defines ingestion limits per user or tenant to prevent system overload.
- Alerting and Ruler Configuration: Sets up how alerting rules are processed and sent to Alertmanager.
- Compactor and Retention: Manages data compaction and retention policies to save storage.
admin@linuxscratch:~$ mkdir cortex_singlebinarymode
admin@linuxscratch:~$ cd cortex_singlebinarymode/
admin@linuxscratch:~/cortex_singlebinarymode$ cat cortex-config.yaml
# yaml-language-server: $schema=https://raw.githubusercontent.com/cortexproject/cortex/master/schemas/cortex-config-schema.json
# Configuration for running Cortex in single-process mode.
# This should not be used in production.  It is only for getting started
# and development.

# https://cortexmetrics.io/docs/configuration/configuration-file/#supported-contents-and-default-values-of-the-config-file
target: all

# Disable the requirement that every request to Cortex has an
# X-Scope-OrgID header. `fake` will be substituted in instead.
auth_enabled: true

# https://cortexmetrics.io/docs/configuration/configuration-file/#server_config
server:
  http_listen_port: 9009

  # Configure the server to allow messages up to 100MB.
  grpc_server_max_recv_msg_size: 104857600
  grpc_server_max_send_msg_size: 104857600
  grpc_server_max_concurrent_streams: 1000

# https://cortexmetrics.io/docs/configuration/configuration-file/#distributor_config
distributor:
  shard_by_all_labels: true
  pool:
    health_check_ingesters: true

# https://cortexmetrics.io/docs/configuration/configuration-file/#ingester_client_config
ingester_client:
  grpc_client_config:
    # Configure the client to allow messages up to 100MB.
    max_recv_msg_size: 104857600
    max_send_msg_size: 104857600
    grpc_compression: gzip

# https://cortexmetrics.io/docs/configuration/configuration-file/#ingester_config
ingester:
  lifecycler:
    # The address to advertise for this ingester.  Will be autodiscovered by
    # looking up address on eth0 or en0; can be specified if this fails.
    # address: 127.0.0.1

    # We want to start immediately and flush on shutdown.
    min_ready_duration: 0s
    final_sleep: 0s
    num_tokens: 512

    # Use an in memory ring store, so we don't need to launch a Consul.
    ring:
      kvstore:
        store: inmemory
      replication_factor: 1

# https://cortexmetrics.io/docs/configuration/configuration-file/#blocks_storage_config
blocks_storage:
  backend: s3
  s3: &s3
    endpoint: linuxscratch.stack.com:8333
    region: local
    bucket_name: cortex-blocks
    access_key_id: any
    secret_access_key: any
    insecure: true
  tsdb:
    dir: /data/tsdb
  bucket_store:
    sync_dir: /data/tsdb-sync
    bucket_index:
      enabled: true

# https://cortexmetrics.io/docs/configuration/configuration-file/#compactor_config
compactor:
  data_dir: /tmp/cortex/compactor
  sharding_ring:
    kvstore:
      store: inmemory

# https://cortexmetrics.io/docs/configuration/configuration-file/#frontend_worker_config
frontend_worker:
  match_max_concurrent: true

# https://cortexmetrics.io/docs/configuration/configuration-file/#ruler_config
ruler:
  enable_api: true

# https://cortexmetrics.io/docs/configuration/configuration-file/#ruler_storage_config
ruler_storage:
  backend: s3
  s3:
    <<: *s3
    bucket_name: cortex-ruler

# https://cortexmetrics.io/docs/configuration/configuration-file/#alertmanager_config
alertmanager:
  external_url: /alertmanager
  enable_api: true
  data_dir: /data/alertmanager

# https://cortexmetrics.io/docs/configuration/configuration-file/#alertmanager_storage_config
alertmanager_storage:
  backend: s3
  s3:
    <<: *s3
    bucket_name: cortex-alertmanager
Here is the docker compose file with custom config volume mounted.
admin@linuxscratch:~/cortex_singlebinarymode$ cat docker-compose.yml
services:
  cortex:
    image: quay.io/cortexproject/cortex:v1.20.1
    command:
      - -config.file=/config/cortex-config.yaml
    volumes:
      - ./cortex-config.yaml:/config/cortex-config.yaml:ro
    ports:
      - "9009:9009"
Instantiate cortex docker service.
admin@linuxscratch:~/cortex_singlebinarymode$ docker compose up -d
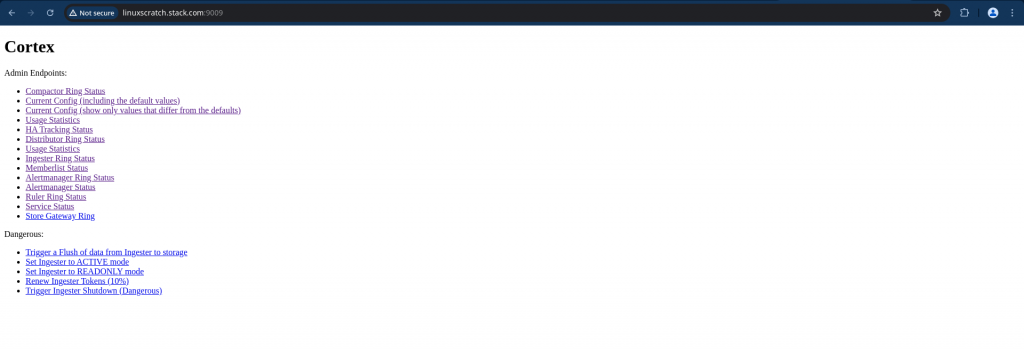
Validate Cortex service status and ensure everything is running by accessing below url.
URL: http://linuxscratch.stack.com:9009/services
Step4: Instantiate Prometheus service
In this step we are going to instantiate prometheus service with a custom configuration file which defines the static targets that needs to scraped.
Also the scraped metrics are further written to the remote cortex service using the API “api/v1/push”. The X-Scope-OrgID header is specifically used by multi-tenant systems like Cortex and Mimir to identify which tenant or organization the incoming metrics belong to.
admin@linuxscratch:~$ mkdir cortex_prometheus
admin@linuxscratch:~$ cd cortex_prometheus
admin@linuxscratch:~/cortex_prometheus$ cat prometheus-config.yaml
global:
  scrape_interval: 15s # Set the scrape interval to every 15 seconds. Default is every 1 minute.
  evaluation_interval: 15s # Evaluate rules every 15 seconds. The default is every 1 minute.

scrape_configs:
  - job_name: "prometheus"
    static_configs:
      - targets: ["linuxscratch.stack.com:9090"]
  - job_name: "cortex"
    static_configs:
      - targets: ["linuxscratch.stack.com:9009"]

remote_write:
  - url: http://linuxscratch.stack.com:9009/api/v1/push
    headers:
      X-Scope-OrgID: "cortex"
  - url: http://linuxscratch.stack.com:9009/api/v1/push
    headers:
      X-Scope-OrgID: "tenant-a"
  - url: http://linuxscratch.stack.com:9009/api/v1/push
    headers:
      X-Scope-OrgID: "tenant-b"
  - url: http://linuxscratch.stack.com:9009/api/v1/push
    headers:
      X-Scope-OrgID: "tenant-c"
  - url: http://linuxscratch.stack.com:9009/api/v1/push
    headers:
      X-Scope-OrgID: "tenant-d"
Here is the docker compose file with custom prometheus config volume mounted.
admin@linuxscratch:~/cortex_prometheus$ cat docker-compose.yml
services:
  prometheus:
    image: prom/prometheus:v3.2.1
    command:
      - --config.file=/config/prometheus-config.yaml
    volumes:
      - ./prometheus-config.yaml:/config/prometheus-config.yaml:ro
    ports:
      - "9090:9090"
Let’s now start up the prometheus service.
admin@linuxscratch:~/cortex_prometheus$ docker compose up -d
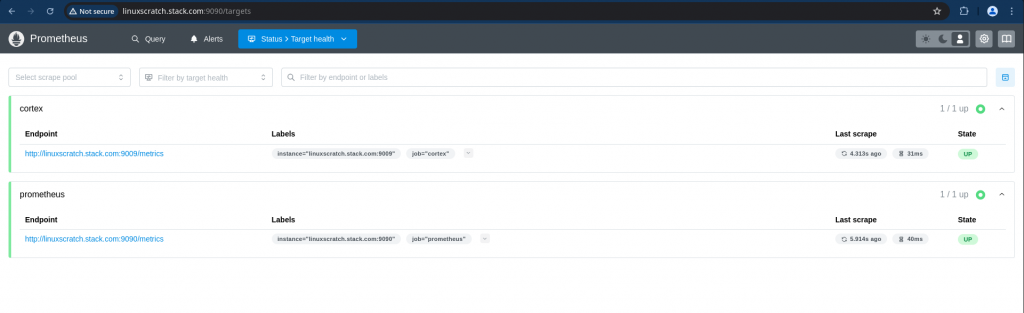
Ensure that the configured target health status is green as shown below.
Step5: Instantiate Grafana service
Here we are going to instantiate Grafana service with preconfigured datasources and dashboards for different Cortext components metrics visualization.
admin@linuxscratch:~$ mkdir cortex_grafana
admin@linuxscratch:~$ cd cortex_grafana/
admin@linuxscratch:~/cortex_grafana$ cat grafana-datasource-docker.yaml
# Grafana datasource configuration for Docker Compose/single binary mode
# For Kubernetes mode, use grafana-datasource.yaml instead
apiVersion: 1

datasources:
  - name: Cortex
    type: prometheus
    access: proxy
    orgId: 1
    url: http://linuxscratch.stack.com:9009/api/prom
    jsonData: &jsonData
      cacheLevel: None
      httpHeaderName1: X-Scope-OrgID
      httpMethod: POST
      prometheusType: Cortex
      prometheusVersion: 1.14.0
      timeInterval: 15s
    secureJsonData:
      httpHeaderValue1: cortex
    version: 1
    editable: true
    isDefault: true
  - name: Tenant A
    type: prometheus
    access: proxy
    orgId: 1
    url: http://linuxscratch.stack.com:9009/api/prom
    jsonData: *jsonData
    secureJsonData:
      httpHeaderValue1: tenant-a
    version: 1
    editable: true
  - name: Tenant B
    type: prometheus
    access: proxy
    orgId: 1
    url: http://linuxscratch.stack.com:9009/api/prom
    jsonData: *jsonData
    secureJsonData:
      httpHeaderValue1: tenant-b
    version: 1
    editable: true
  - name: Tenant C
    type: prometheus
    access: proxy
    orgId: 1
    url: http://linuxscratch.stack.com:9009/api/prom
    jsonData: *jsonData
    secureJsonData:
      httpHeaderValue1: tenant-c
    version: 1
    editable: true
  - name: Tenant D
    type: prometheus
    access: proxy
    orgId: 1
    url: http://linuxscratch.stack.com:9009/api/prom
    jsonData: *jsonData
    secureJsonData:
      httpHeaderValue1: tenant-d
    version: 1
    editable: true
  - orgId: 1
    name: Cortex Alertmanager
    type: alertmanager
    access: proxy
    url: http://linuxscratch.stack.com:9009/
    jsonData:
      httpHeaderName1: X-Scope-OrgID
      implementation: cortex
    secureJsonData:
      httpHeaderValue1: cortex
    version: 1
admin@linuxscratch:~/cortex_grafana$ cat grafana-dashboard.yaml
apiVersion: 1

providers:
  - name: "dashboards"
    orgId: 1
    type: file
    disableDeletion: false
    updateIntervalSeconds: 60
    allowUiUpdates: false
    options:
      path: /var/lib/grafana/dashboards
      foldersFromFilesStructure: true
For the sample grafana dashboard you can refer to the following “Sample Cortex Grafana Dashboard” and volume mount them by placing under “dashboards” folder.
Here is the docker compose file with the volume mounted datasource and dashboard data.
admin@linuxscratch:~/cortex_grafana$ cat docker-compose.yml
services:
  grafana:
    image: grafana/grafana:10.4.2
    environment:
      - GF_AUTH_ANONYMOUS_ENABLED=true
      - GF_AUTH_ANONYMOUS_ORG_ROLE=Admin
      - GF_USERS_DEFAULT_THEME=light
      - GF_LOG_MODE=console
      - GF_LOG_LEVEL=critical
    volumes:
      - ./grafana-datasource-docker.yaml:/etc/grafana/provisioning/datasources/datasource.yaml:ro
      - ./grafana-dashboard.yaml:/etc/grafana/provisioning/dashboards/dashboards.yaml:ro
      - ./dashboards/:/var/lib/grafana/dashboards/:ro
    ports:
      - "3000:3000"
Now let’s instantiate the grafana service.
admin@linuxscratch:~/cortex_grafana$ docker compose up -d
Validate you able to access the grafana dashboard
URL: http://linuxscratch.stack.com:3000/dashboards
Step6: Validate data flow
Here we will validate that the metrics are flowing from Prometheus → Cortex → Grafana.
If everything is configured correctly the prometheus_remote_storage_count metric count keep increasing.
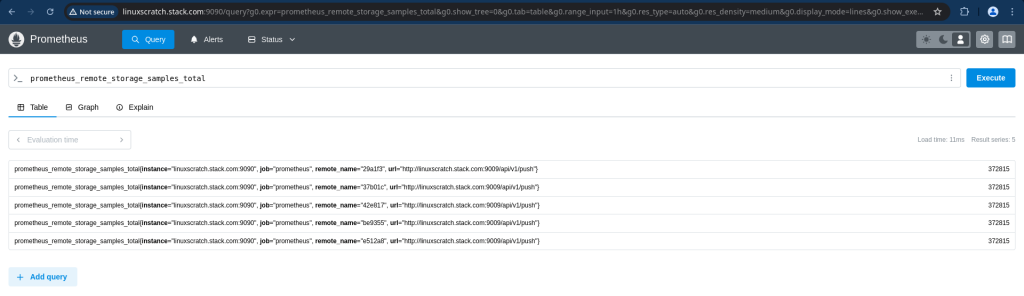
Now let’s query metrics in cortex by passing the tenant id in the header. The X-Scope-OrgID header specifies which tenant’s data to query.
admin@linuxscratch:~$ curl -H "X-Scope-OrgID: cortex" "http://linuxscratch.stack.com:9009/prometheus/api/v1/query?query=up" | jq
  % Total    % Received % Xferd  Average Speed   Time    Time     Time  Current
                                 Dload  Upload   Total   Spent    Left  Speed
100   286  100   286    0     0  52660      0 --:--:-- --:--:-- --:--:-- 57200
{
  "status": "success",
  "data": {
    "resultType": "vector",
    "result": [
      {
        "metric": {
          "__name__": "up",
          "instance": "linuxscratch.stack.com:9009",
          "job": "cortex"
        },
        "value": [
          1770190559,
          "1"
        ]
      },
      {
        "metric": {
          "__name__": "up",
          "instance": "linuxscratch.stack.com:9090",
          "job": "prometheus"
        },
        "value": [
          1770190559,
          "1"
        ]
      }
    ]
  }
}
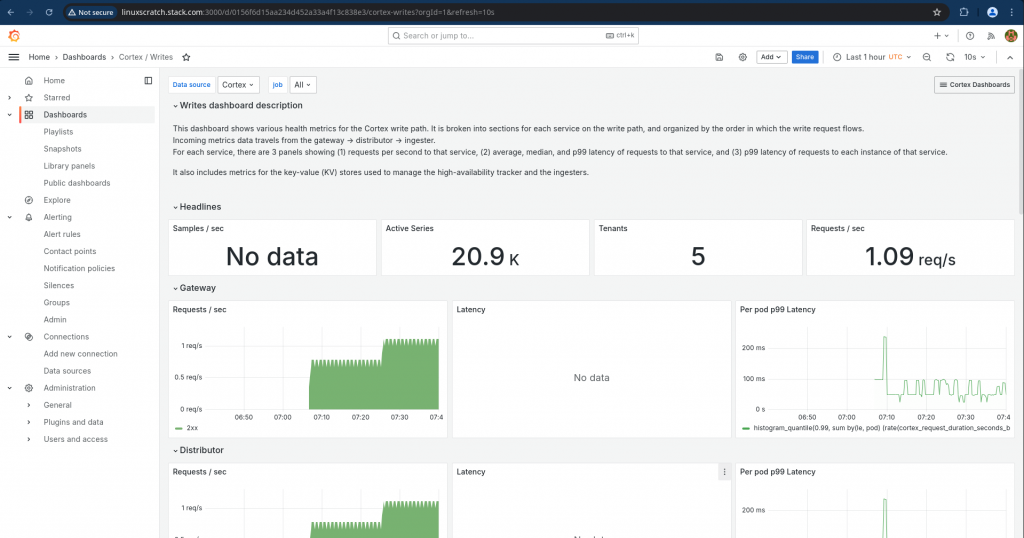
Now let’s validate that the grafana dashboard is populated with the metrics data.
Also we can validate that the seaweedfs object store is populated with the blocks of metrics as shown below.
First list’s list the buckets in the seaweedsfs.
admin@linuxscratch:~$ curl -sS --aws-sigv4 "aws:amz:local:seaweedfs" --user "any:any" http://linuxscratch.stack.com:8333 | xmllint --format -
<?xml version="1.0" encoding="UTF-8"?>
<ListAllMyBucketsResult xmlns="http://s3.amazonaws.com/doc/2006-03-01/">
  <Owner>
    <DisplayName/>
    <ID/>
  </Owner>
  <Buckets>
    <Bucket>
      <CreationDate>2026-02-05T07:08:19Z</CreationDate>
      <Name>cortex-alertmanager</Name>
    </Bucket>
    <Bucket>
      <CreationDate>2026-02-05T07:08:19Z</CreationDate>
      <Name>cortex-blocks</Name>
    </Bucket>
    <Bucket>
      <CreationDate>2026-02-05T07:08:19Z</CreationDate>
      <Name>cortex-ruler</Name>
    </Bucket>
  </Buckets>
</ListAllMyBucketsResult>
Now let’s list the objects in the cortex-blocks object store.
admin@linuxscratch:~$ curl -sS --aws-sigv4 "aws:amz:local:seaweedfs" --user "any:any" http://linuxscratch.stack.com:8333/cortex-blocks?list-type=2 | xmllint --format -
<?xml version="1.0" encoding="UTF-8"?>
<ListBucketResult xmlns="http://s3.amazonaws.com/doc/2006-03-01/">
  <Name>cortex-blocks</Name>
  <Prefix/>
  <MaxKeys>10000</MaxKeys>
  <IsTruncated>false</IsTruncated>
  <Contents>
    <Key>cortex/01KGPBS3QMK62VR2P23BSGTC8M/chunks/000001</Key>
    <ETag>"c92ea5d562e51a98cc7f6e3e2998fdcb"</ETag>
    <Size>400171</Size>
    <Owner>
      <ID>0</ID>
    </Owner>
    <StorageClass>STANDARD</StorageClass>
    <LastModified>2026-02-05T07:38:01Z</LastModified>
  </Contents>
...
Hope you enjoyed reading this article. Thank you..
Leave a Reply
You must be logged in to post a comment.