How to monitor Docker containers metrics using cAdvisor on Fedora
Here in this article we will try to monitor Docker contianers metrics using cAdvisor. These metrics can further be scraped using the prometheus server for analysis.
Test Environment
- Fedora 41 server
- Docker
- Docker Compose
- Prometheus
What is cAdvisor
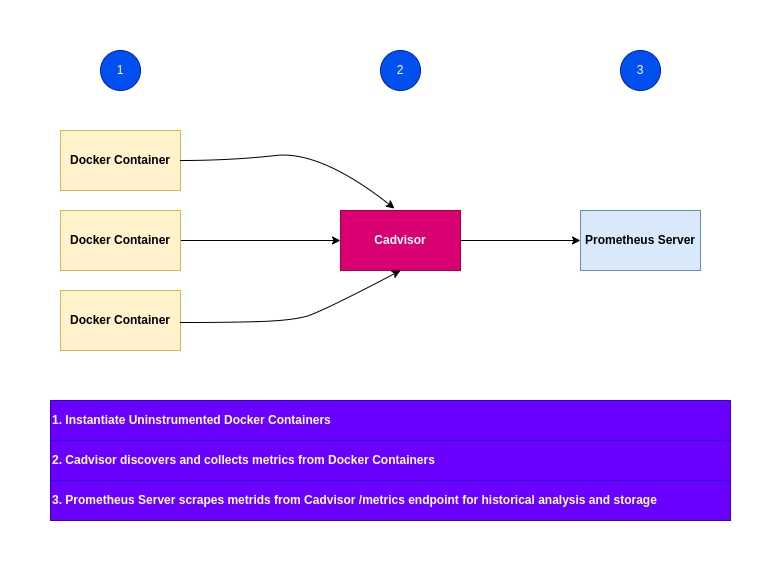
cAdvisor is a specialized agent that collects, aggregates, and exports real-time container resource metrics (CPU, memory, I/O) from Docker hosts. cAdvisor provides only real-time insights into container statistics.
What is Prometheus
Prometheus is a comprehensive, time-series database and alerting engine that scrapes, stores, and analyzes that data. It stores historical data for long-term analysis and alerting.
High Level Architecture
If you are interested in watching the video. Here is the YouTube video on the same step by step procedure outlined below.
Procedure
Step1: Ensure Docker installed and running
As a first step ensure that you have docker installed and running on the system. Follow official docker documentation pages to install the same.
Ensure that the docker daemon service is up and running.
admin@linuxscratch:~$ sudo systemctl start docker.service
admin@linuxscratch:~$ sudo systemctl status docker.service
Step2: Instantiate cAdvisor docker service
Here we are going to instantiate cAdvisor docker service which will help in collecting resource usage and performance characteristics of the running containers. The docker compose file includes directories with Docker state cAdvisor needs to observe.
admin@linuxscratch:~/cadvisordemo$ cat docker-compose.yml
services:
  cadvisor:
    image: gcr.io/cadvisor/cadvisor:latest
    container_name: cadvisor
    #privileged: true
    ports:
    - 8080:8080
    volumes:
    - /:/rootfs:ro
    - /var/run:/var/run:rw
    - /sys:/sys:ro
    - /dev:/dev:ro
    - /cgroup:/cgroup:ro
    - /var/lib/docker/:/var/lib/docker:ro
If you are getting the below error while starting up the cadvisor container.
Error: W0201 16:34:37.477514 1 fs.go:649] Unable to get btrfs mountpoint IDs: stat failed on /dev/vda3 with error: no such file or directory
This error typically occurs because cAdvisor is unable to find the host’s block devices (like /dev/vda3) from within the container, which is common on Fedora or systems using BTRFS and cgroups v2. You can enable the following volume mount or enable privileged mode so that cadvisor container is able to get all the metrics without any errors.
- Mount the /dev Directory: If cAdvisor needs to see the actual block devices to map mountpoints, ensure you are mounting the host’s /dev or /dev/mapper directly into the container: –volume=/dev:/dev:ro or –volume=/dev/mapper:/dev/mapper:ro.
- Enable Privileged Mode: Ensure the container is running with elevated privileges to access host filesystem metadata: –privileged=true.
Let’s now start up the cadvisor container.
admin@linuxscratch:~/cadvisordemo$ docker compose up -d
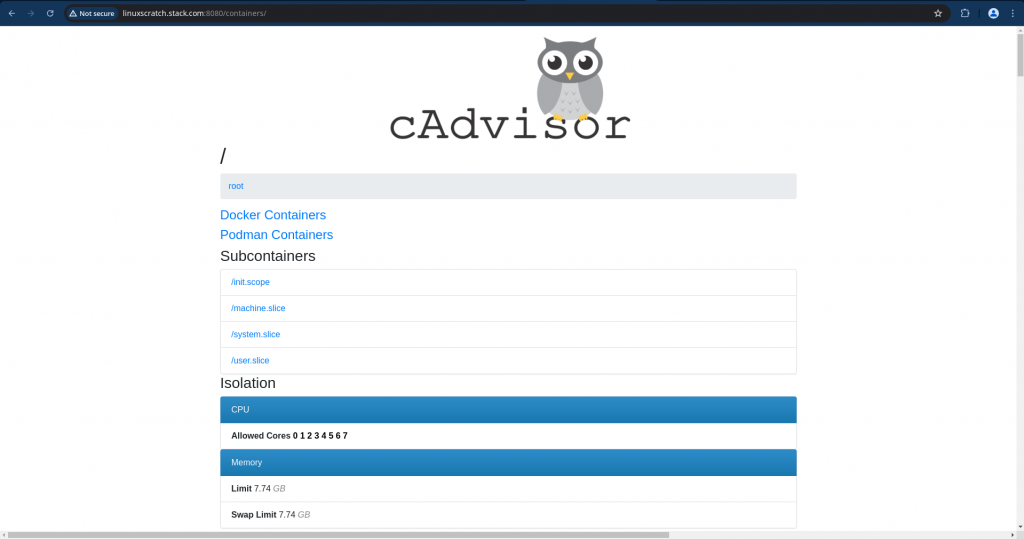
Validate the cadvisor web ui available at port 8080.
URL: http://linuxscratch.stack.com:8080
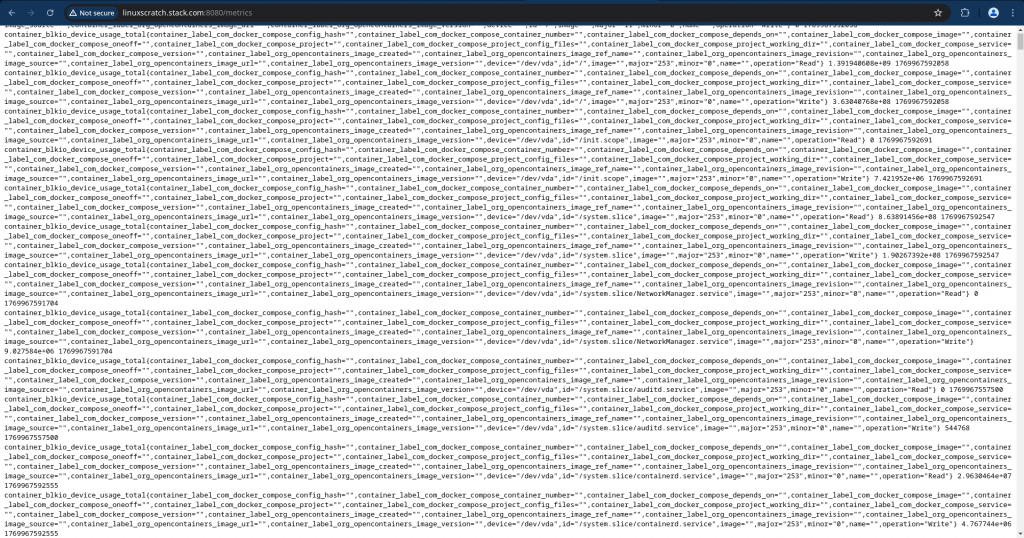
Also by default the cadvisor service exposes its metrics on following endpoint.
URL: http://linuxscratch.stack.com:8080/metrics
Step3: Instantiate Prometheus service
Here we are going to instantiate prometheus service with an configuration file defined within the docker compose file as shown below. We are configuring prometheus to scrape “cadvisor” metrics at port 8080.
admin@linuxscratch:~/cadvisorprometheus$ cat docker-compose.yml
configs:
  prometheus_config:
    content: |
      scrape_configs:
        - job_name: 'cadvisor'
          scrape_interval: 5s
          static_configs:
            - targets: ['linuxscratch.stack.com:8080']

services:
  prometheus:
    image: prom/prometheus:latest
    container_name: prometheus
    ports:
      - 9090:9090
    command:
      - --config.file=/etc/prometheus/prometheus.yml
    configs:
      - source: prometheus_config
        target: /etc/prometheus/prometheus.yml
        uid: "65534"    # Required: numeric UID for 'nobody' user
        gid: "65534"    # Required: numeric GID for 'nobody' group
        mode: 0400      # Required: read-only permissions
Let’s now start up the prometheus container.
admin@linuxscratch:~/cadvisorprometheus$ docker compose up -d
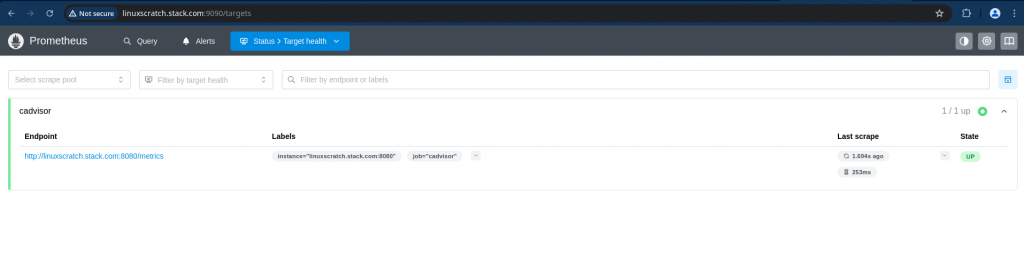
Now let’s validate the cadvisor target status on prometheus portal.
Step4: Instantiate sample docker container
Here we are going to instantiate a flowise as sample docker container which we would like to monitor using cadvisor and scrape metrics using prometheus for historical analysis.
admin@linuxscratch:~/flowisedemo$ cat docker-compose.yml
services:
  flowise:
    image: flowiseai/flowise:3.0.11
    container_name: flowise
    ports:
      - 3000:3000
    volumes:
      - flowise:/root/.flowise
    networks:
      - flowise-net

volumes:
  flowise:

networks:
  flowise-net:
Let’s now start up the flowise container.
admin@linuxscratch:~/flowisedemo$ docker compose up -d
Now, we can validate the flowise portal accessible on port 3000.
URL: http://linuxscratch.stack.com:3000
Step5: Validate Container metrics
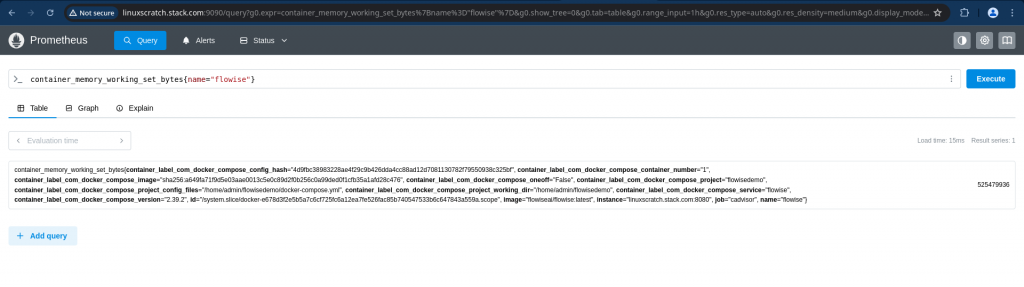
Now let’s use the prometheus expression browser to query some of the metrics for the “flowise” sample container as shown below.
Query: rate(container_cpu_usage_seconds_total{name="flowise"}[1m])
Description: The cgroup's CPU usage in the last minute

Query: container_memory_working_set_bytes{name="flowise"}
Description: Reports "actual usage" memory by subtracting reclaimable cache.
Hope you enjoyed reading this article. Thank you..
Leave a Reply
You must be logged in to post a comment.