How to scrape Docker container metrics using Prometheus

Here in this article we will try to setup prometheus to discover docker container and scrape docker daemon and container metrics.
Test Environment
- Fedora 41 server
- Docker
- Docker Compose
- Prometheus
What is Prometheus
Prometheus is an open-source systems monitoring and alerting toolkit. It is used to collects and stores metrics as time series data, i.e. metrics information is stored with the timestamp at which it was recorded, alongside optional key-value pairs called labels. The targets from which the metrics needs to be scraped are discovering either using the static configuration or through service discovery.
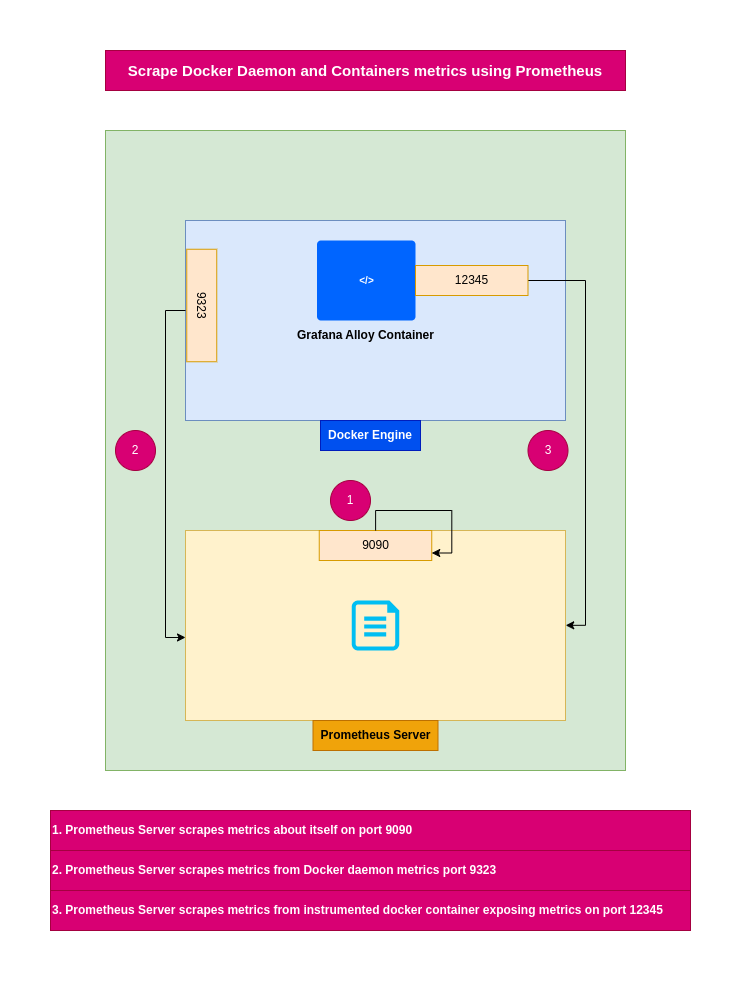
High Level Architecture

If you are interested in watching the video. Here is the YouTube video on the same step by step procedure outlined below.
Procedure
Step1: Ensure Docker installed and running
As a first step ensure that you have docker installed and running on the system. Follow official docker documentation pages to install the same.
Ensure that the docker daemon service is up and running.
admin@linuxscratch:~$ sudo systemctl start docker.service
admin@linuxscratch:~$ sudo systemctl status docker.service
Step2: Ensure Prometheus installed and running
Here in this step we are going to download the prometheus server binary, extract it and start up the prometheus server with the default configuration file “prometheus.yml” which scrapes itself.
admin@linuxscratch:~$ wget https://github.com/prometheus/prometheus/releases/download/v3.9.1/prometheus-3.9.1.linux-amd64.tar.gz
admin@linuxscratch:~$ tar -xzvf prometheus-3.9.1.linux-amd64.tar.gz
admin@linuxscratch:~$ cd prometheus-3.9.1.linux-amd64/
admin@linuxscratch:~/prometheus-3.9.1.linux-amd64$ ./prometheus --config.file=prometheus.yml
Access the prometheus portal and verify the target status to ensure that it is able to scrape itself.
URL: http://linuxscratch.stack.com:9090/

Step3: Update Docker Daemon for exposing metrics
Here are going to update the Docker daemon configuration file (ie. daemon.json) to exposes Prometheus-compatible metrics on port 9323 via the loopback interface. We are configuring it to use the wildcard address 0.0.0.0 for demo purpose.
NOTE: This will expose the Prometheus port to the wider network.
admin@linuxscratch:~$ cat /etc/docker/daemon.json
{
  "metrics-addr": "0.0.0.0:9323"
}
Step4: Update Prometheus config to discover docker daemon and containers
Here we are going to update the “prometheus.yml” file to scrape metrics from docker daemon, docker containers and prometheus server itself as shown below.
- docker_sd_configs: Docker SD configurations allow retrieving scrape targets from Docker Engine hosts. This SD discovers “containers” and will create a target for each network IP and port the container is configured to expose.
- static_configs: A static_config allows specifying a list of targets and a common label set for them. It is the canonical way to specify static targets in a scrape configuration.
admin@linuxscratch:~/prometheus-3.9.1.linux-amd64$ cat prometheus.yml
global:
  scrape_interval:     15s
  evaluation_interval: 15s

scrape_configs:
  - job_name: prometheus
    scrape_interval: 15s
    static_configs:
      - targets: ['localhost:9090']

  - job_name: "docker"
    static_configs:
      - targets: ["localhost:9323"]

  - job_name: docker-containers
    docker_sd_configs:
      - host: unix:///var/run/docker.sock
Restart the prometheus server with the updated configuration or you can as well reload the prometheus process with SIGHUP signal.
admin@linuxscratch:~/prometheus-3.9.1.linux-amd64$ ./prometheus --config.file=prometheus.yml
Step5: Instantiate instrumented docker container
Here we are going to instantiate a sample containerized application “Grafana Alloy” which is instrumeted to expose its metrics in prometheus compatible format.
Let’s create a sample grafana alloy configuration file to load.
admin@linuxscratch:~/grafana-alloy$ cat config.alloy
logging {
  level  = "debug"
  format = "logfmt"
 }
Update docker compose file to instantiate grafana alloy application with the custom configuration as shown below.
admin@linuxscratch:~/grafana-alloy$ cat docker-compose.yml
services:
  alloy:
    image: grafana/alloy:v1.7.5
    ports:
      - 12345:12345
    volumes:
      - ./config.alloy:/etc/alloy/config.alloy
      - /var/run/docker.sock:/var/run/docker.sock
    command: run --server.http.listen-addr=0.0.0.0:12345 --storage.path=/var/lib/alloy/data /etc/alloy/config.alloy
Let’s start up the docker container service.
admin@linuxscratch:~/grafana-alloy$ docker compose up -d
Step5: Validate Docker daemon and container metrics
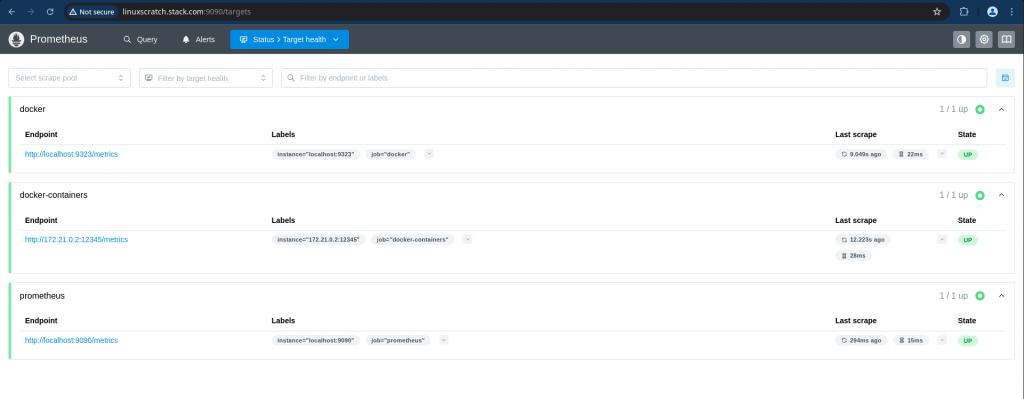
Now let’s try to revalidate the target health status of each target configured in the prometheus configuration.
We should now be able to see that prometheus is able to successfully scrape metrics from Docker daemon, Grafana Alloy docker container and prometheus server itself as shown below.

Here let’s try to explore some of the metrics that are scraped from docker daemon and container as shown below.
Query: engine_daemon_engine_info

Query: alloy_build_info

Hope you enjoyed reading this article. Thank you..
Leave a Reply
You must be logged in to post a comment.